
Hello everyone. In today’s article, we will look at the past performance of the 1 Hour Elliott Wave chart of Netflix Inc. ($NFLX). The rally from 1.17.2024 low at $476.01 unfolded as 5 waves impulse. So, we expected the pullback to unfold in 7 swings and find buyers again. We will explain the structure & forecast below:
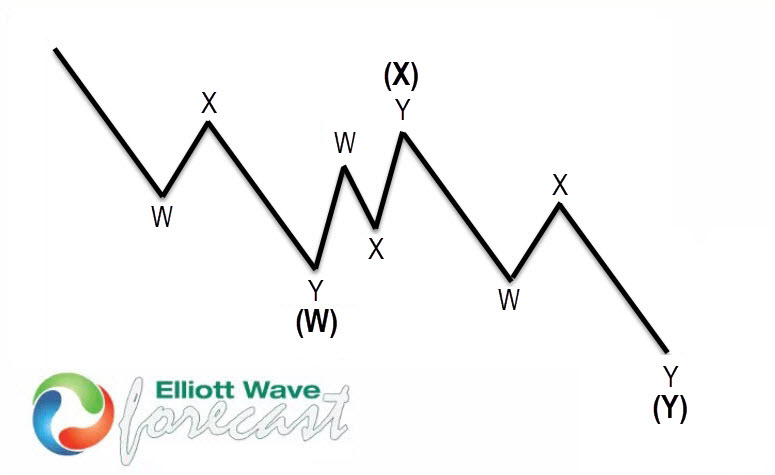
Double Three (WXY) Corrective Structure
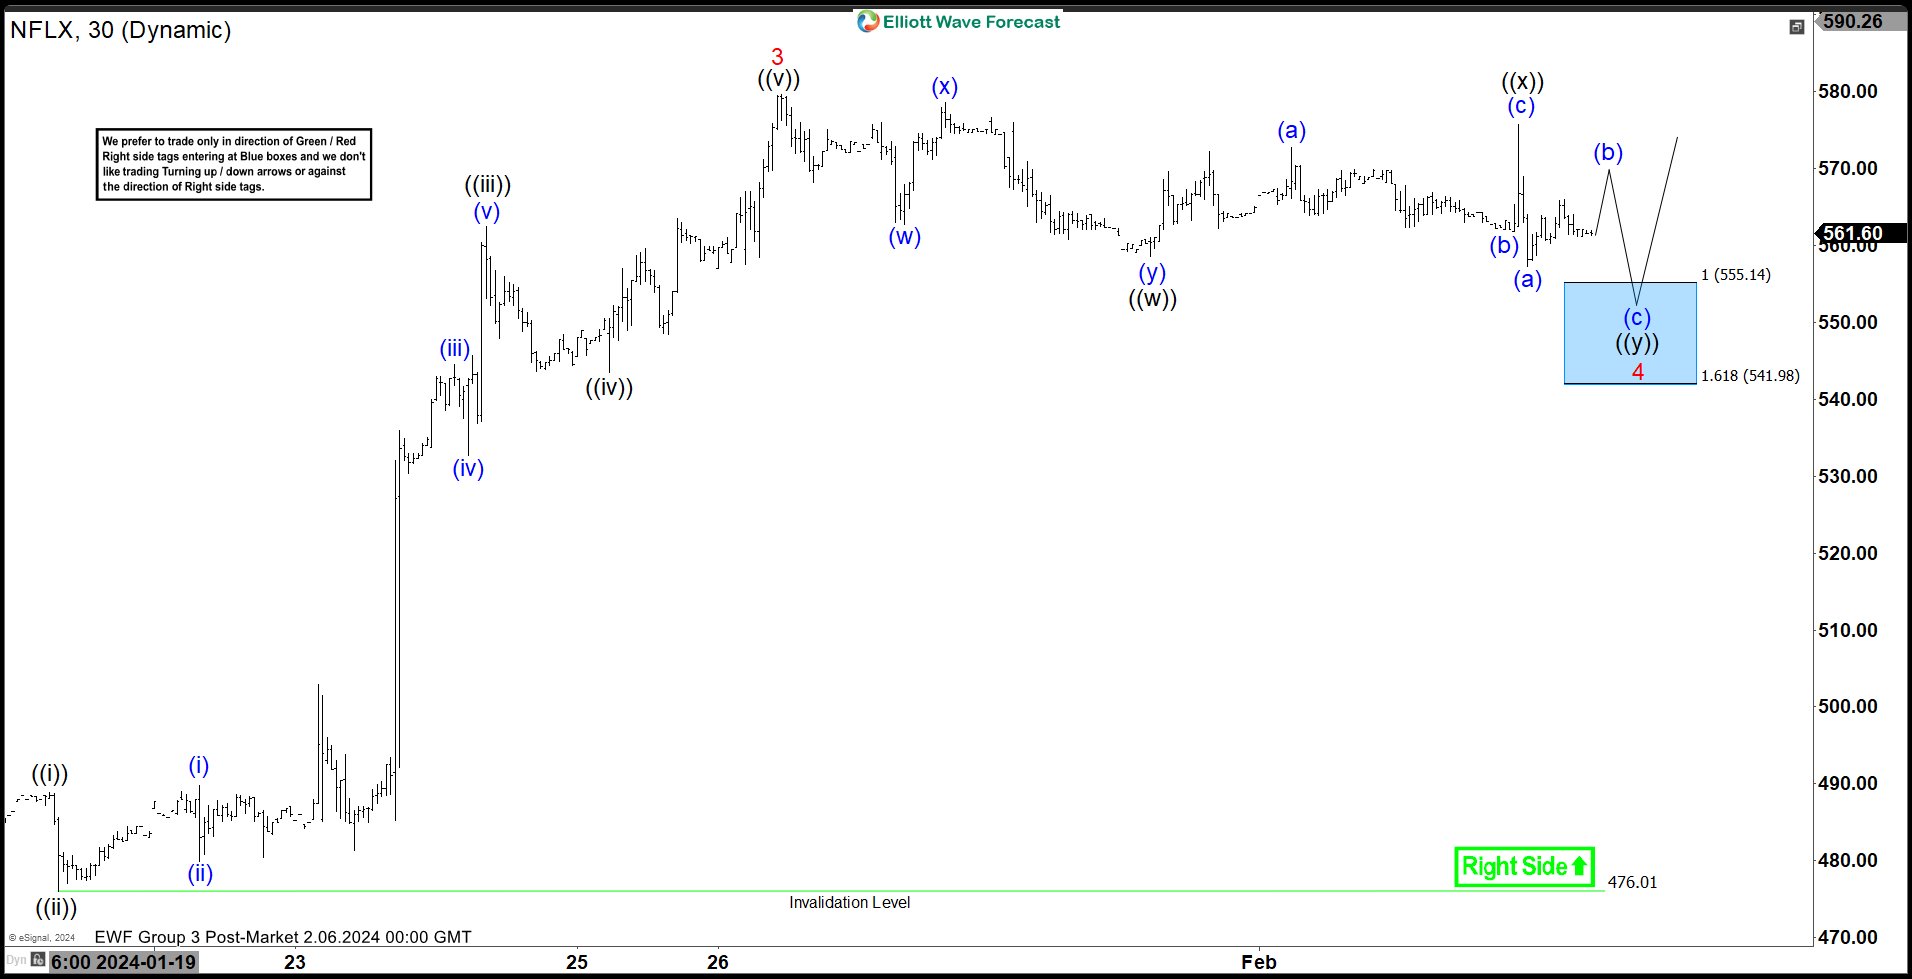
$NFLX 1H Elliott Wave Chart 2.06.2024:
Here is the 1H Elliott Wave count from 2.06.2024. We expected the pullback to find buyers at the blue box area at 555.14 – 541.98 in a 7 swing structure (WXY).
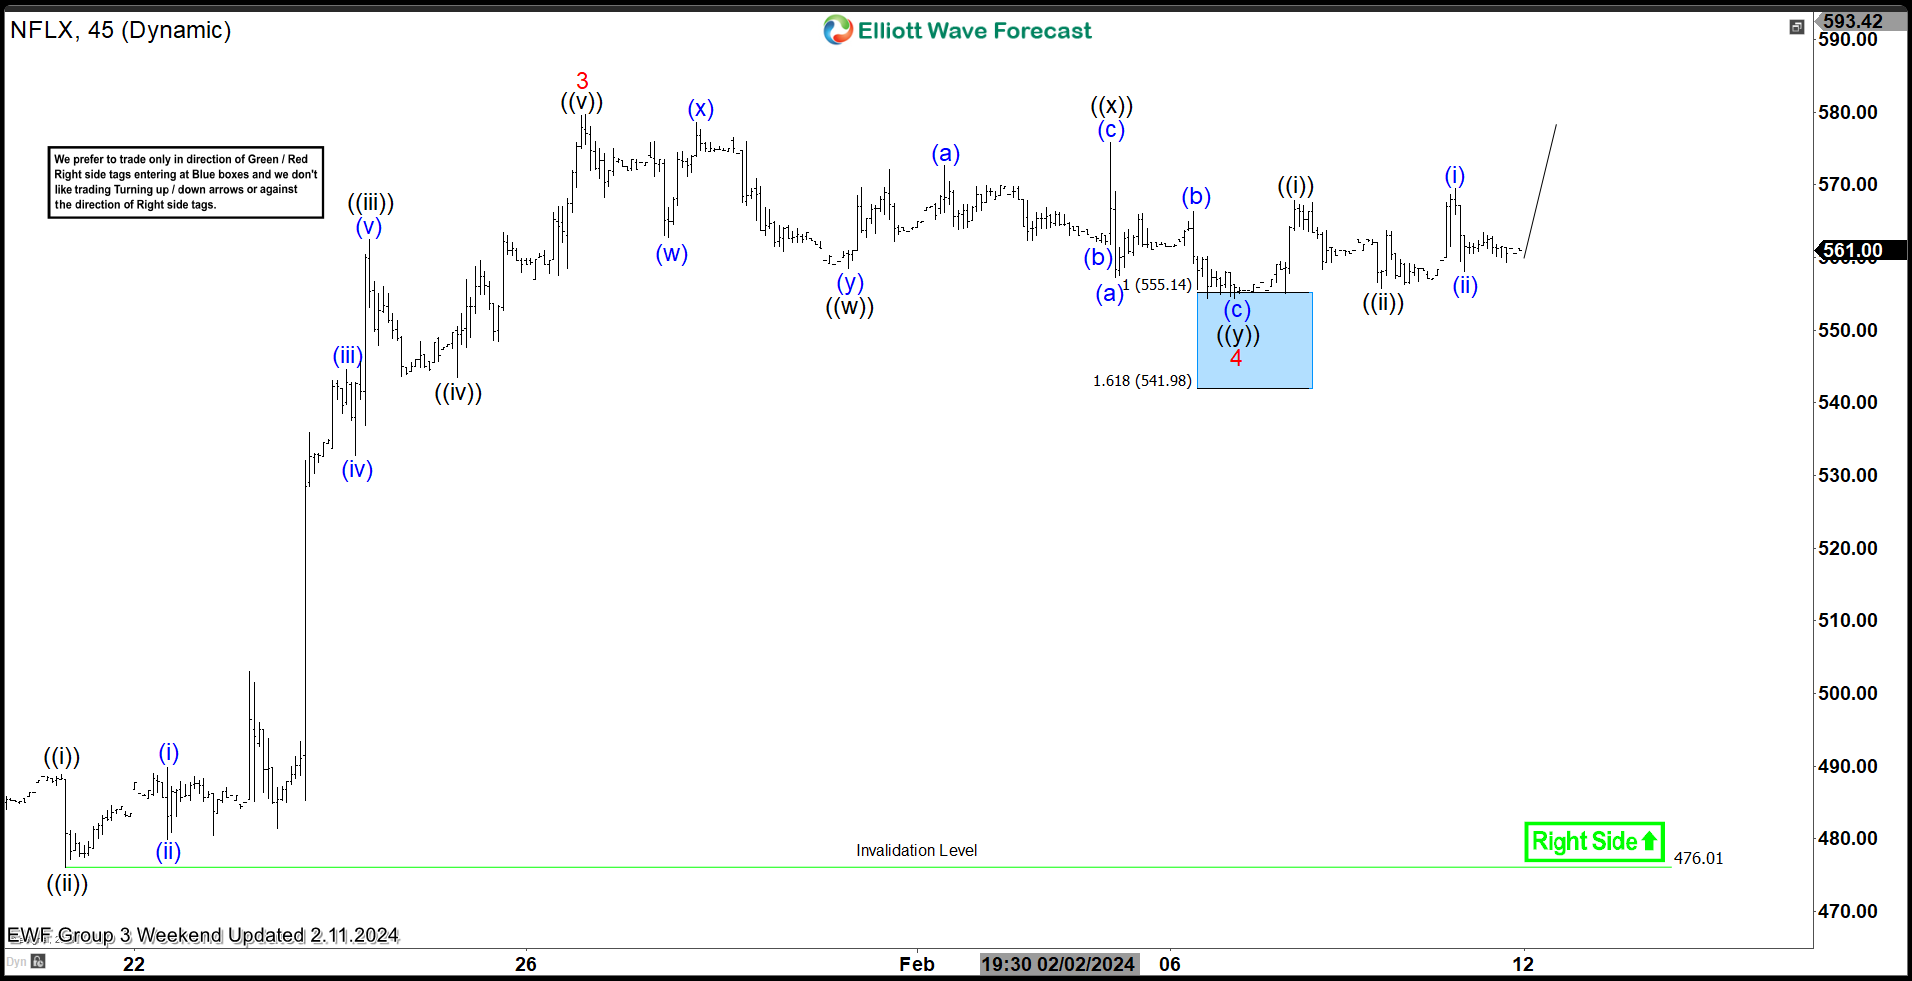
$NFLX 1H Elliott Wave Chart 2.11.2024:
Here is the 1H update few days later from 2.11.2024 showing the bounce taking place as expected. The stock reacted higher from the blue box after doing a Double Three correction allowing longs to get a risk free position. The stock is expected to remain supported towards $588 – 600 before another pullback can happen.
Source: https://elliottwave-forecast.com/stock-market/netflix-inc-nflx-found-buyers-blue-box-area-expected/