
Shopify (NYSE: SHOP) is a cloud-based commerce platform that provides software for building and operating e-commerce businesses. In Q3 FY2023, Shopify’s revenue was up 25% YoY and gross profit was up 36% YoY. The company also reported positive free cash flow for the fourth consecutive quarter, which reached 16% of revenue.
After the news, SHOP surged +22%. We believe that technical aspects rule the market and news is an after-fact event to drive the market into a predetermined direction. Based on the Elliott Wave Theory, it is possible to define the current structure taking place within the daily cycle and predict what the market is looking for in the future.
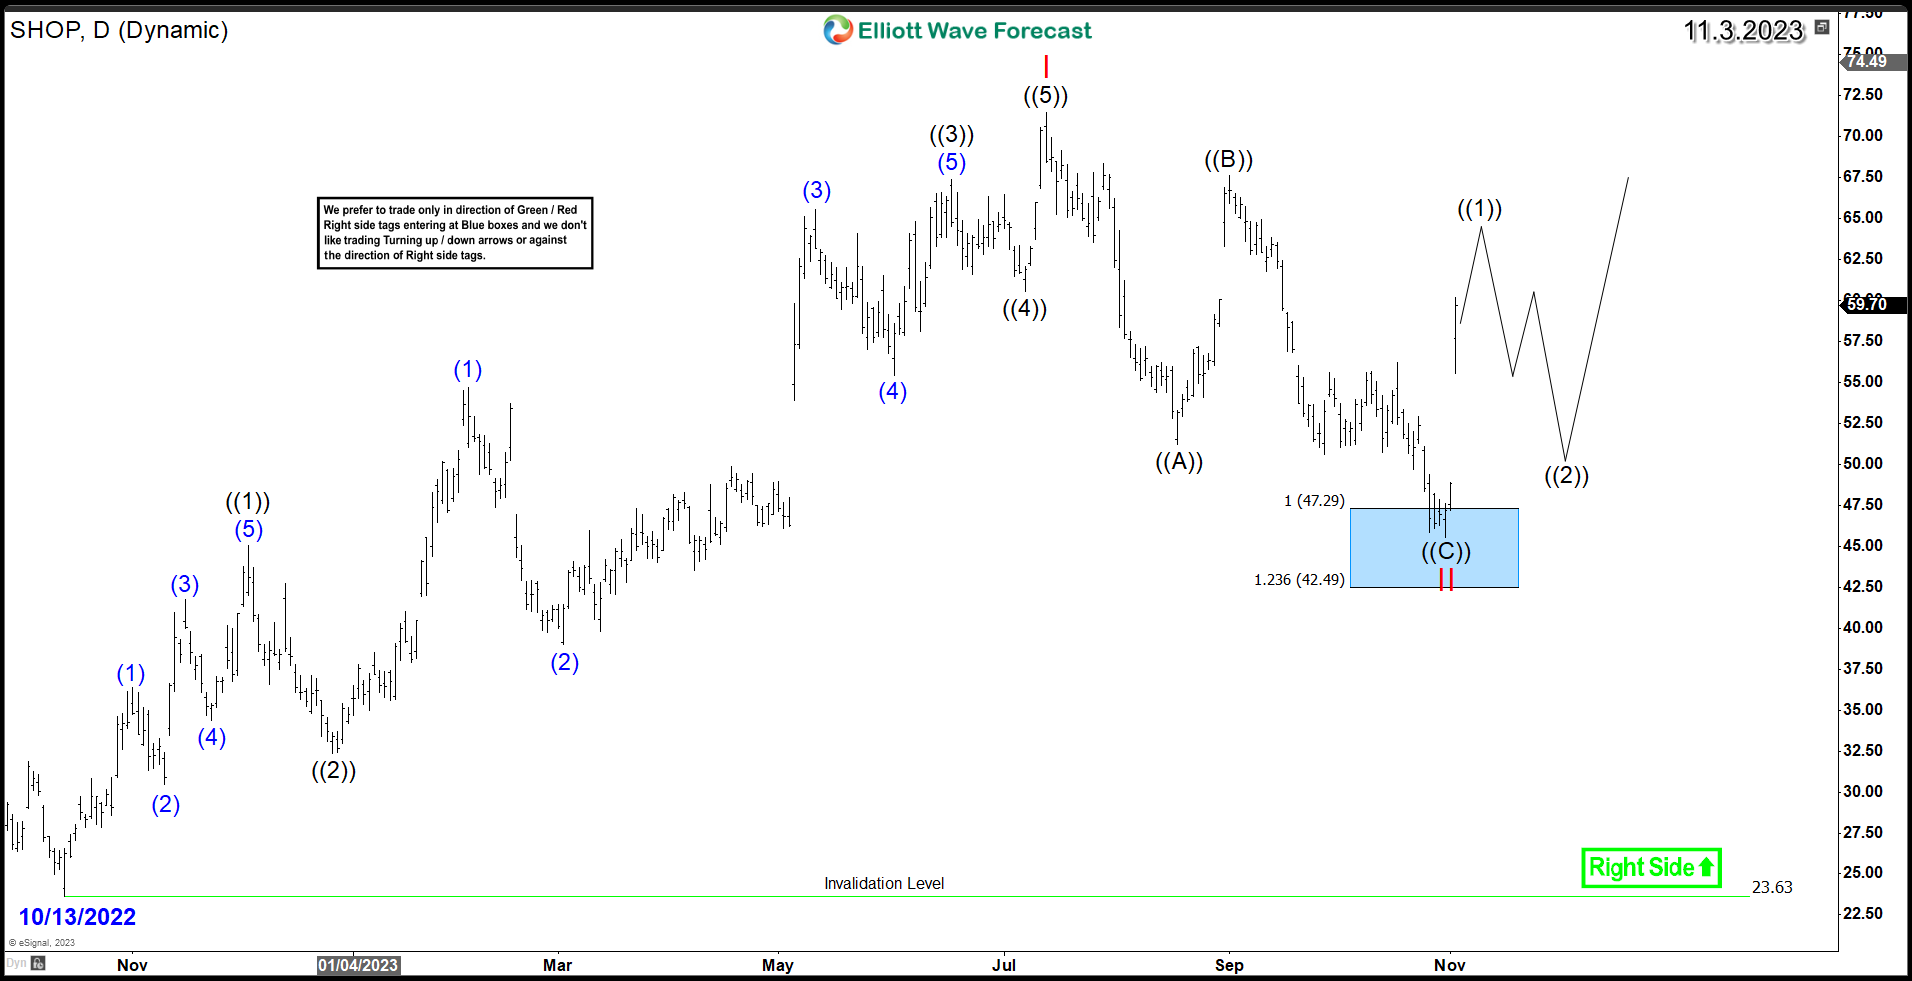
The main daily cycle started on the 13th of October 2022 at $23.63 low. It unfolded within an impulsive 5 waves structure which ended on the 14th of July at $71.43 peak. This move is proposed to be wave I and the decline from July peak was the wave II. The move lower unfolded as a 3 waves ZigZag structure and managed to reach the Blue Box at equal legs area $47 – $42. From there, a strong reaction to the upside took place. If the next pullback remains supported above $45.5, it could be the start of the wave III. In that case, the stock is expected to surge above July peak, creating a new bullish sequence. It will be aiming for a higher target at the $93 – $122 area.
Shopify Daily Chart 11.3.2023
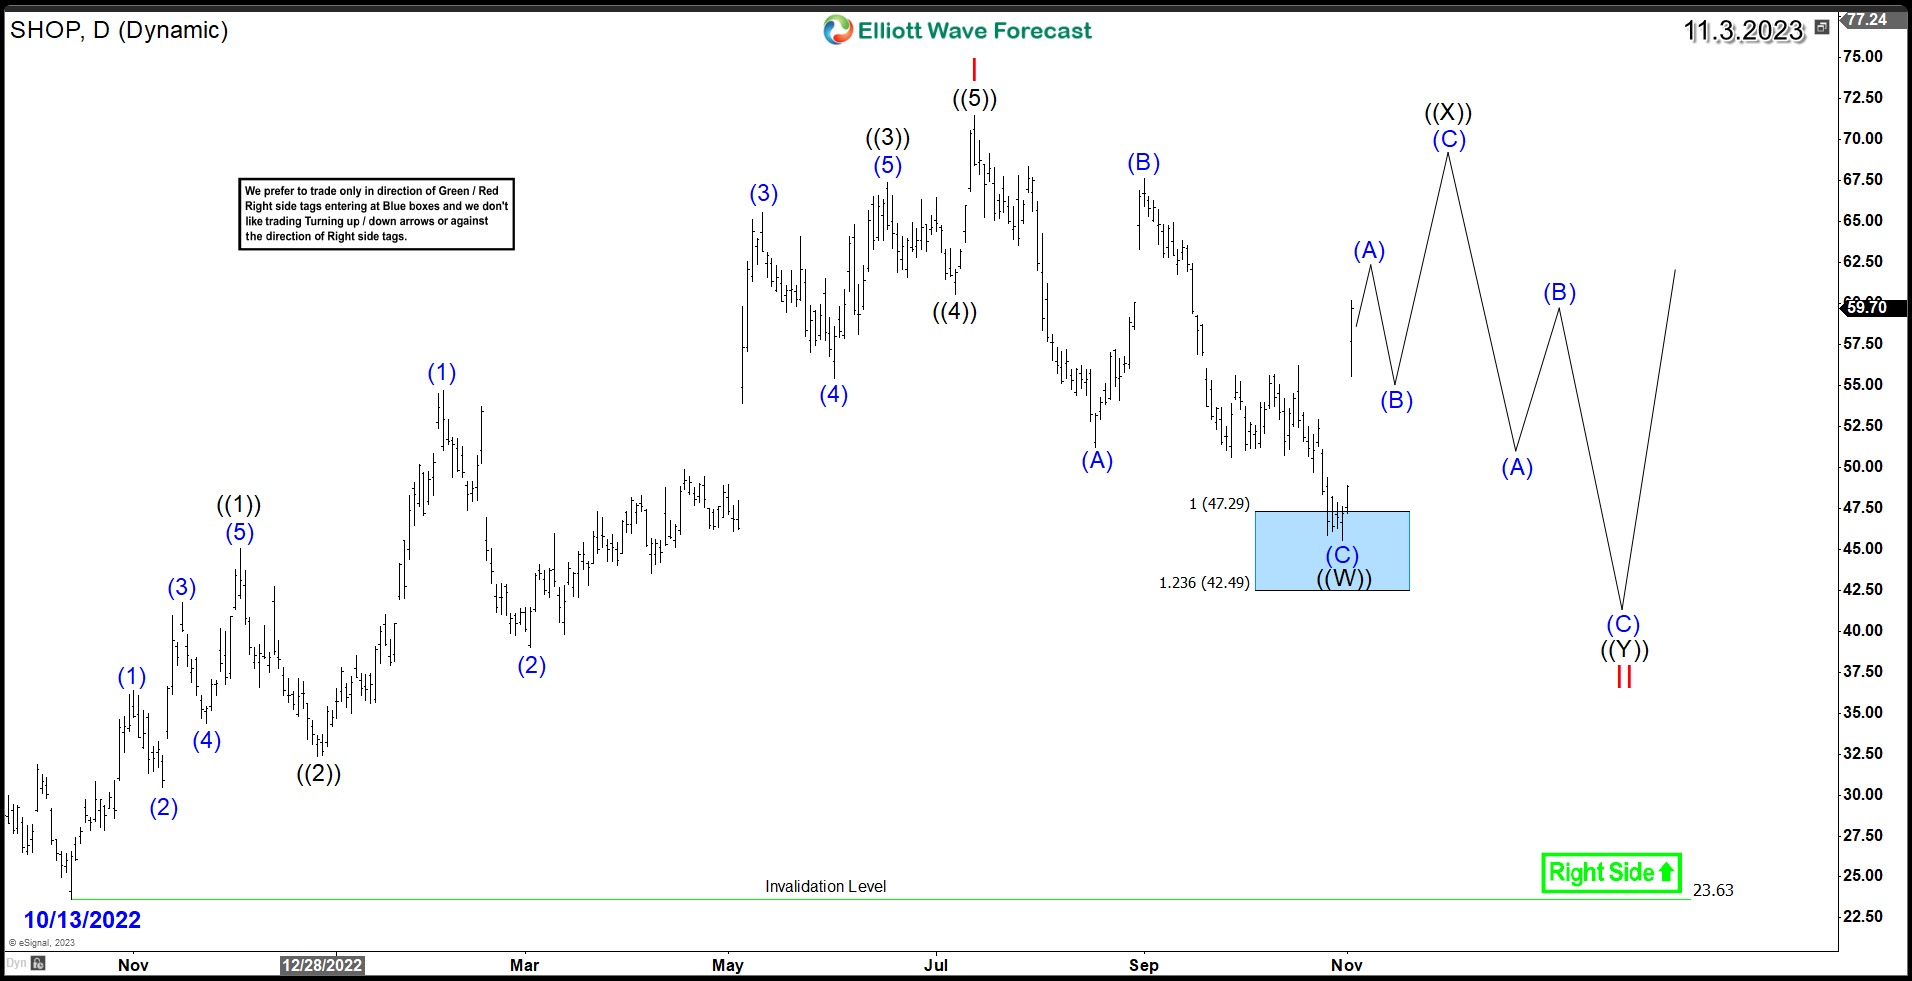
If the current rally fails to break above $71.43, then the proposed wave II may still be in progress within a potential Double Three corrective structure. This suggests that another 3 waves lower will take place to finish the entire 7 swings structure from July peak. As a result, another investment opportunity for the stock could arise because another extreme blue box area may be available for buyers to join the daily cycle.
Shopify Daily Chart ( Double Three Correction )
Source: https://elliottwave-forecast.com/video-blog/shopify-shop-bullish-structure/