
AT&T Inc. (T) is an American multinational telecommunications holding company headquartered in Dallas, Texas. It is the world’s largest telecommunications company by revenue and the third-largest provider of mobile telephone services in the U.S.
AT&T Monthly Chart April 2023
In the monthly chart above, we can see that AT&T shares finished an all-time high with a price of $45.23. Since the beginning of 1999, the value has held a downtrend and we are looking to end this correction. Using the Elliott Wave Principle, a double correction structure (w), (x) and (y) can be clearly seen. From the peak, we have 3 waves in a flat structure that ends wave (w) at $14.17. Then we have another flat structure that built a wave (x) ending in the value of $33.33.
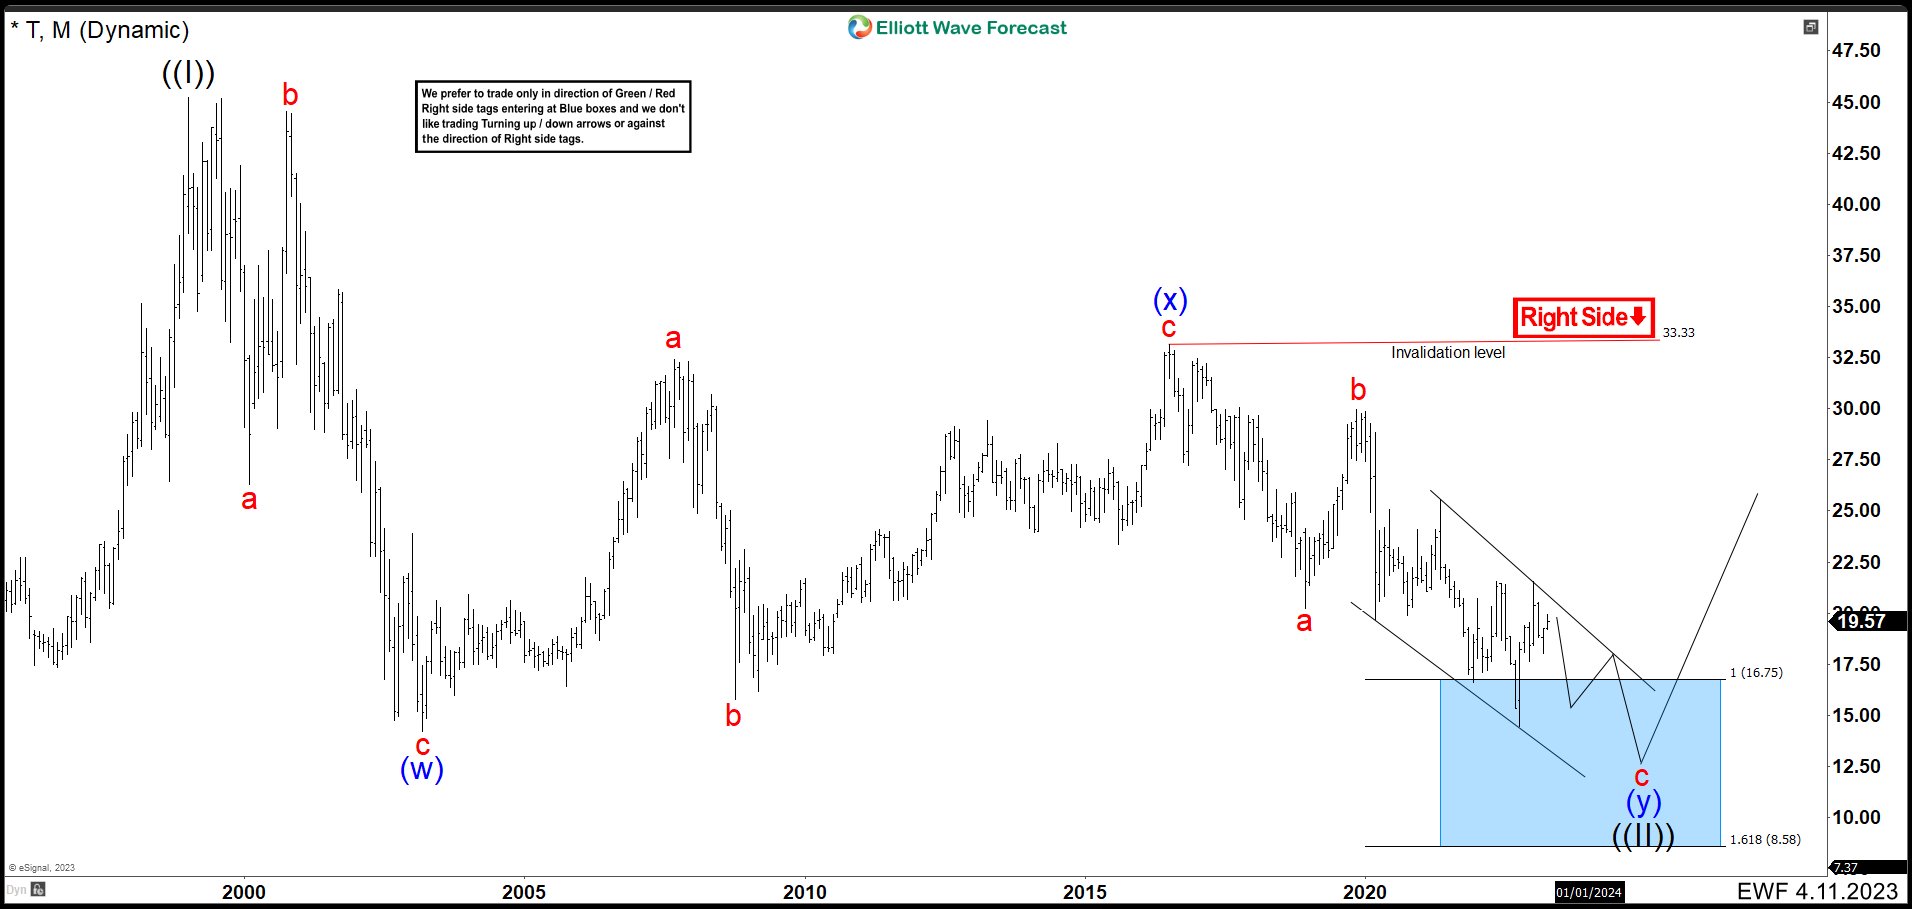
The last leg of the double correction is the wave (y). We have already completed wave a and b, and we are developing wave c as an ending diagonal structure. The market has already reached the blue box in the $8.58 – $16.75 area, but with the current market conditions and the incomplete structure, the price should drop below $14.17.
AT&T Weekly Chart April 2023
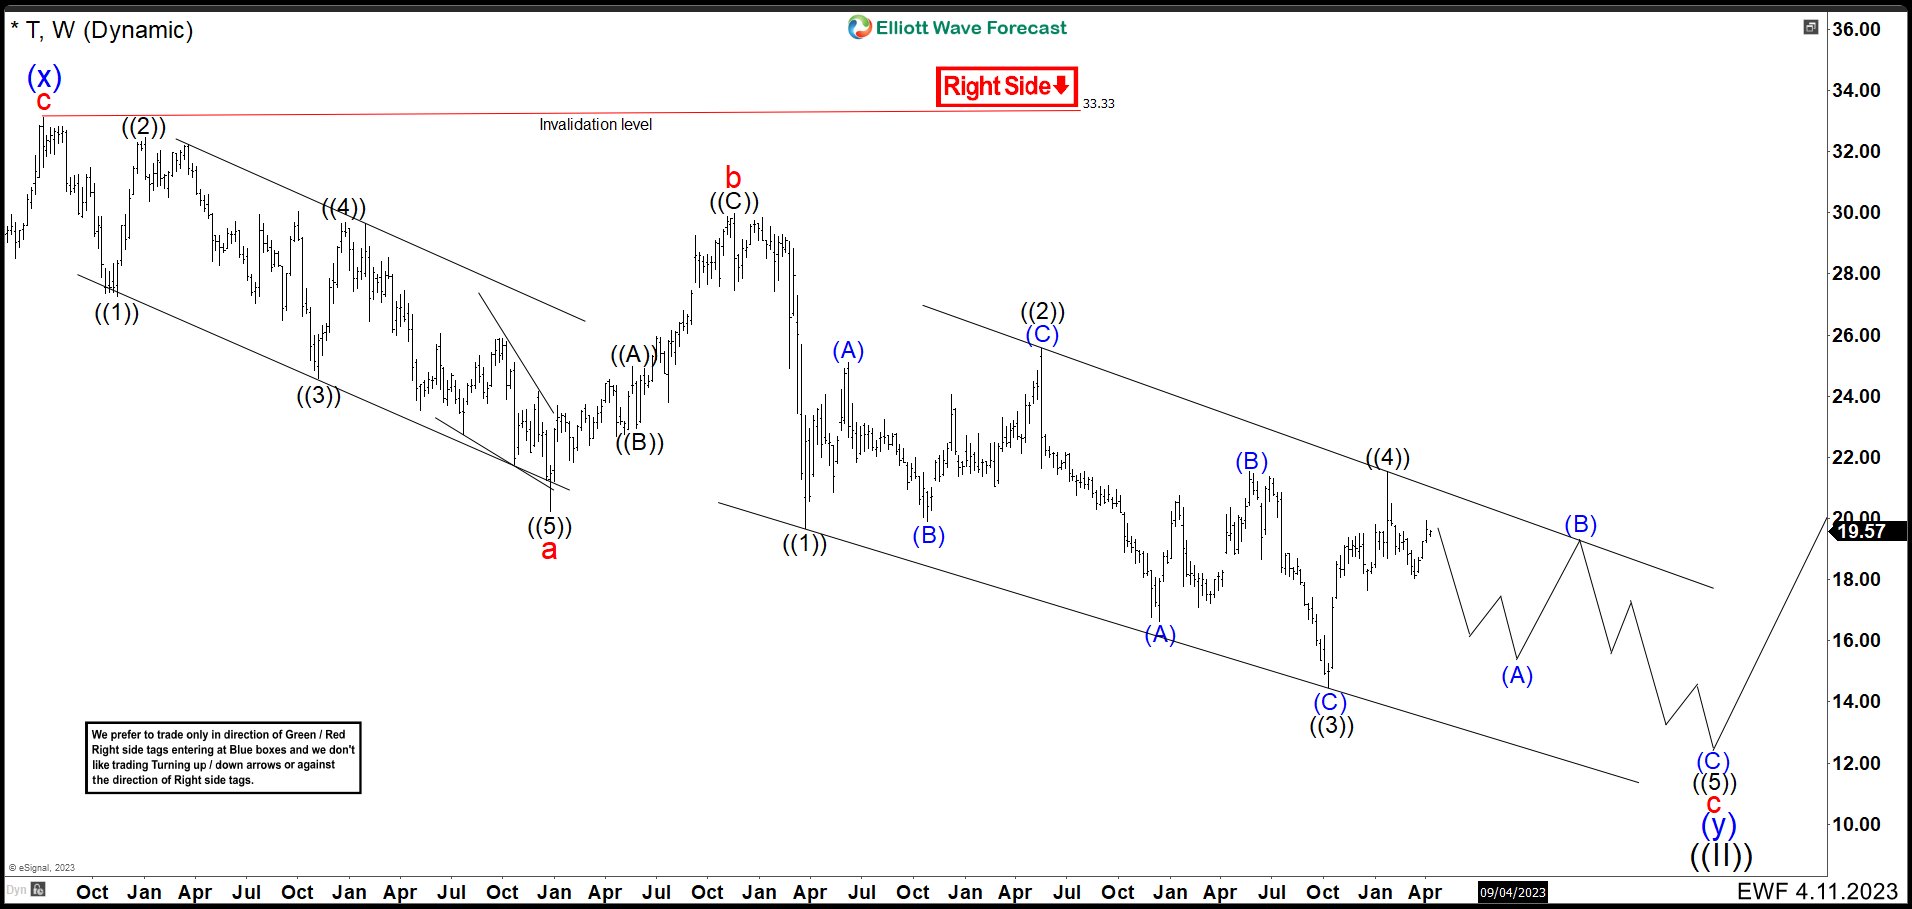
On the weekly chart, we can see in more detail the structure of the wave (y). Wave a in red made a leading diagonal that ended at $20.21. Then it bounced in 3 waves ending wave b at $29.96 to continue sharply lower. Wave c has taken the form of an ending diagonal and it needs 3 more waves to the downside that break the price of $14.17 to confirm the structure. Once $14.17 is broken, we have to analyze the structure to determine the best place to finish wave (y) and the full cycle correction of the 1999 peak as wave ((II)). In time, look for long entries in AT&T (T).
Source: https://elliottwave-forecast.com/stock-market/elliott-wave-suggests-att-stock-continue-dropping/