Hello fellow traders. In this article we’re going to take a quick look at the Elliott Wave charts of E-Mini S&P 500 ( ES_F) published in members area of the website. As our members know ES_F ended cycle from the 3790.2 low as 5 waves structure and we have been forecasting the correction. In the further text we are going to explain the Elliott Wave Forecast.
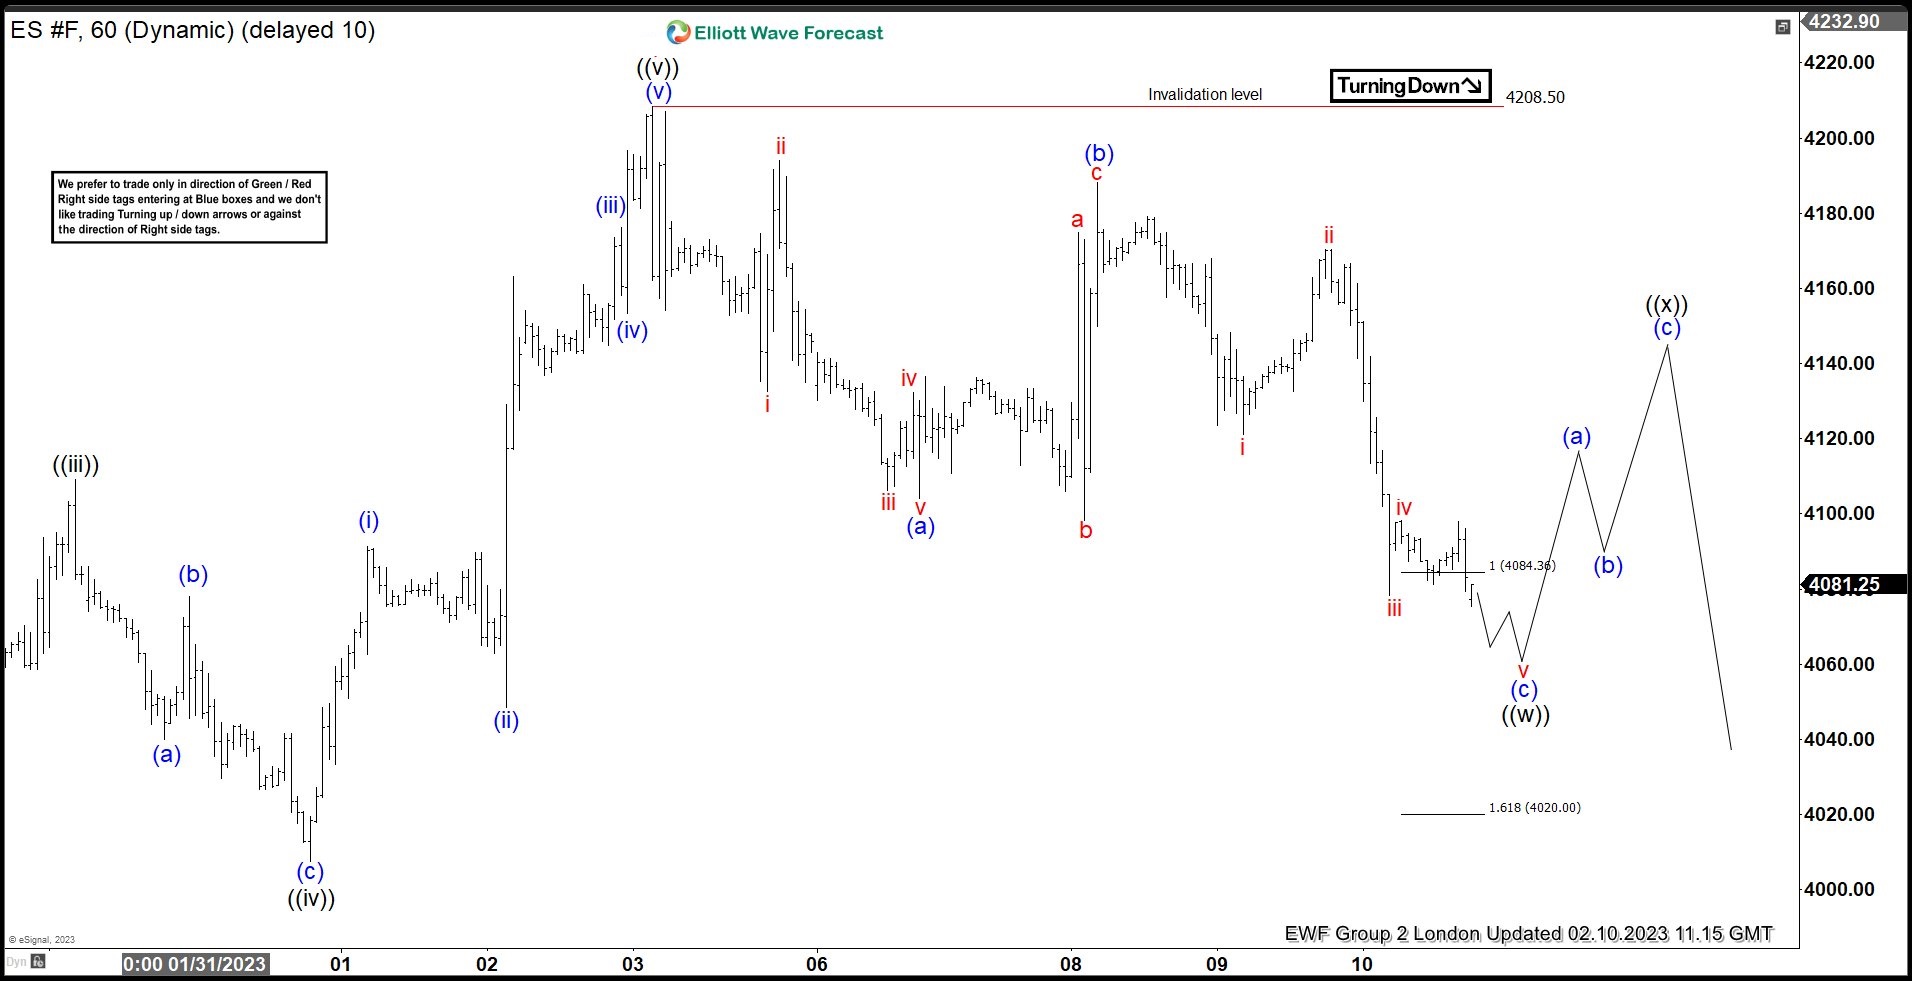
ES_F Elliott Wave 1 Hour Chart 02.10.2022
We are calling cycle from the 3790.2 low completed at the 4208.5 peak. Currently the ES_F is doing correction against the 3790.2 low. The price structure from the high looks like Elliott Wave Zig Zag Pattern. We assume ES_F is about to end first leg of pull back around 4084.3-4202.0 area. Buyers should ideally appear for the 3 waves pull back any moment. As far as the bounce holds below 4208.5 and that pivot holds intact, we expect further weakness ideally.
You can learn more about Elliott Wave Patterns at our Free Elliott Wave Educational Web Page.
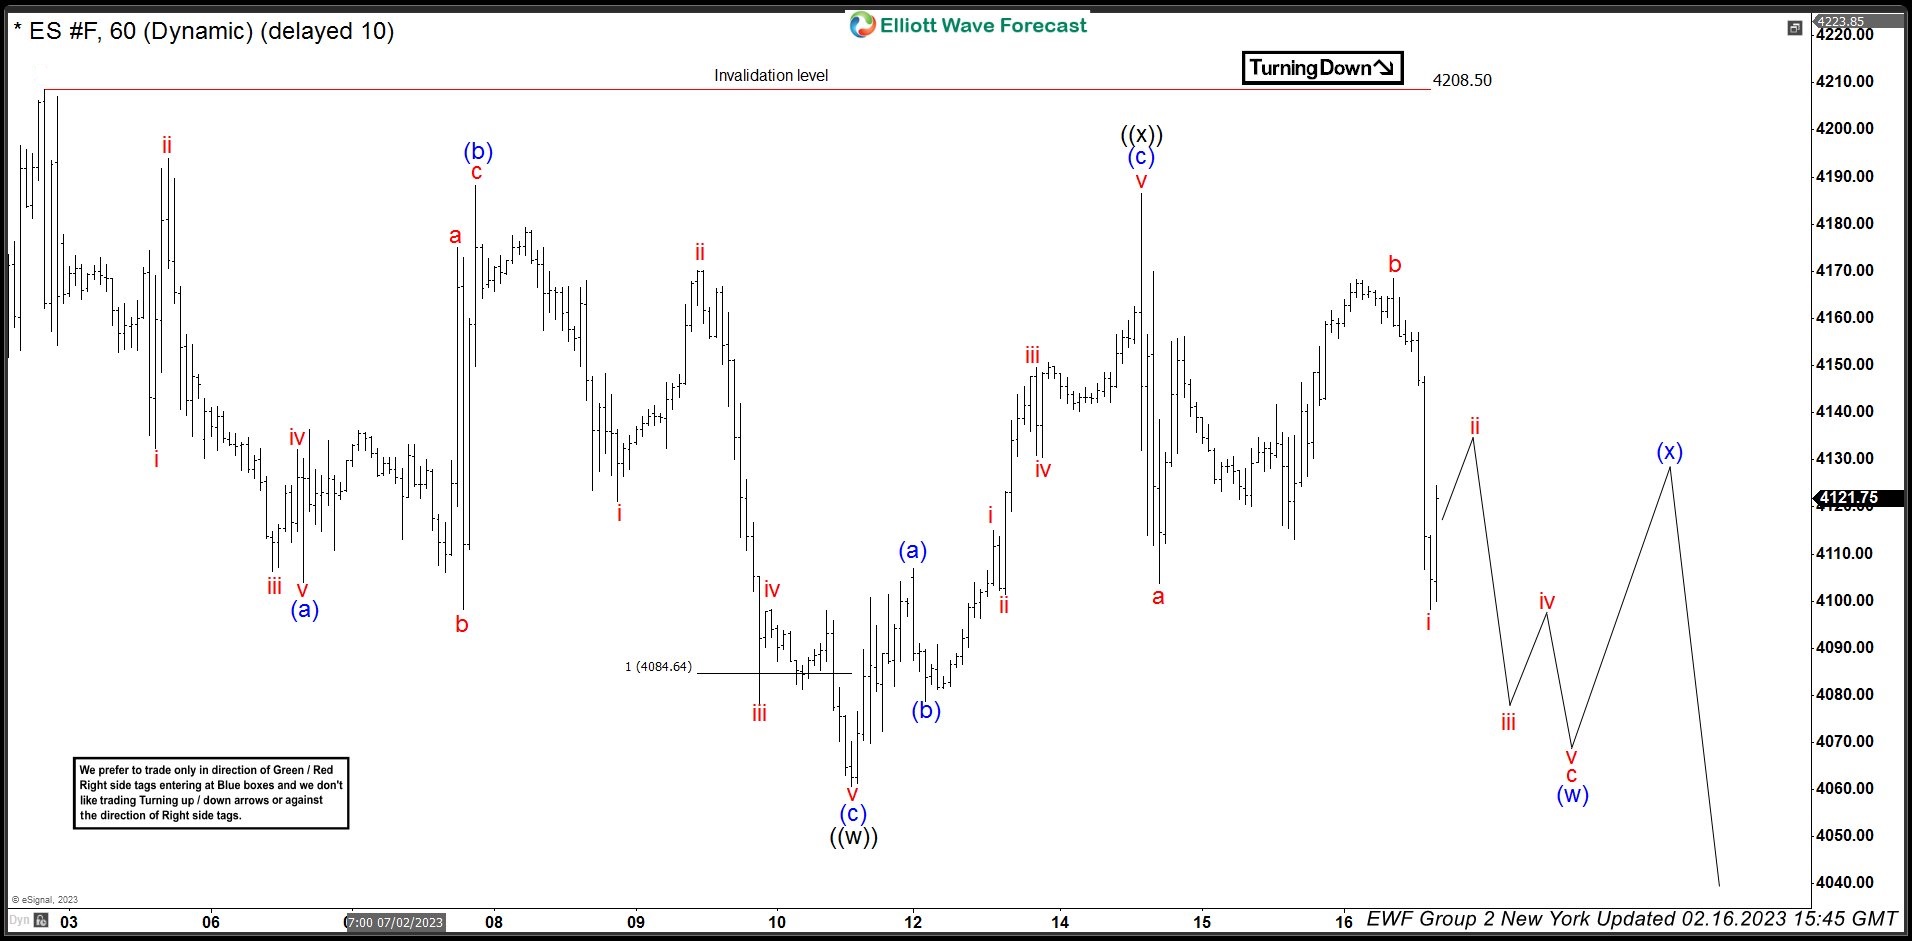
ES_F Elliott Wave 1 Hour Chart 02.16.2022
ES_F made 3 waves bounce against the 4208.5 peak which held well during the rally. Correction ended at the 4185.7 high and now we assume next leg down is in progress. As far as the price stays below 4185.7 peak, ES_F should ideally see further weakness toward 4036.5-3943.3 area. From that zone we can get further rally in S&P 500 E-Mini Futures either toward new highs or in 3 waves bounce at least.
Keep in mind that market is dynamic and presented view could have changed in the mean time. You can check most recent charts with target levels in the membership area of the site Best instruments to trade are those having incomplete bullish or bearish swings sequences. We put them in Sequence Report and best among them are shown in the Live Trading Room
Source: https://elliottwave-forecast.com/stock-market/sp-500-spx-forecasting-path/