
Swatch Group is a Swiss manufacturer of watches and jewellery. Besides the product line Swatch, the group owns brands including Blancpain, Breguet, ETA, Glashütte, Omega, Longines, Tissot, Hamilton, Certina, Rado and Harry Winston. As a matter of fact, the Swatch company employs about 36000 people in over 50 countries. Founded 1983 and headquartered in Biel/Bienne, Switzerland, it can be traded under tickers $UHRN and $UHR at Six Swiss Exchange. After printing the all-time highs in April 2014, the stock price has lost about 3/4 of the price by March 2020. Currently, we see Swatch starting a new larger cycle higher.
In the initial article from March 2021, we have called for a new cycle up. We were right. Then, we saw a pullback reseting part of the rise from March 2020 lows. In the last article from May 2022, we have analyzed the consolidation pattern and provided a buying area for medium- and long-term investors. Indeed, the stock has bounced from 40.95-29.82 area. We were right again. Now, we see Swatch starting next bullish cycle. In the current blog we will provide an update including price targets.
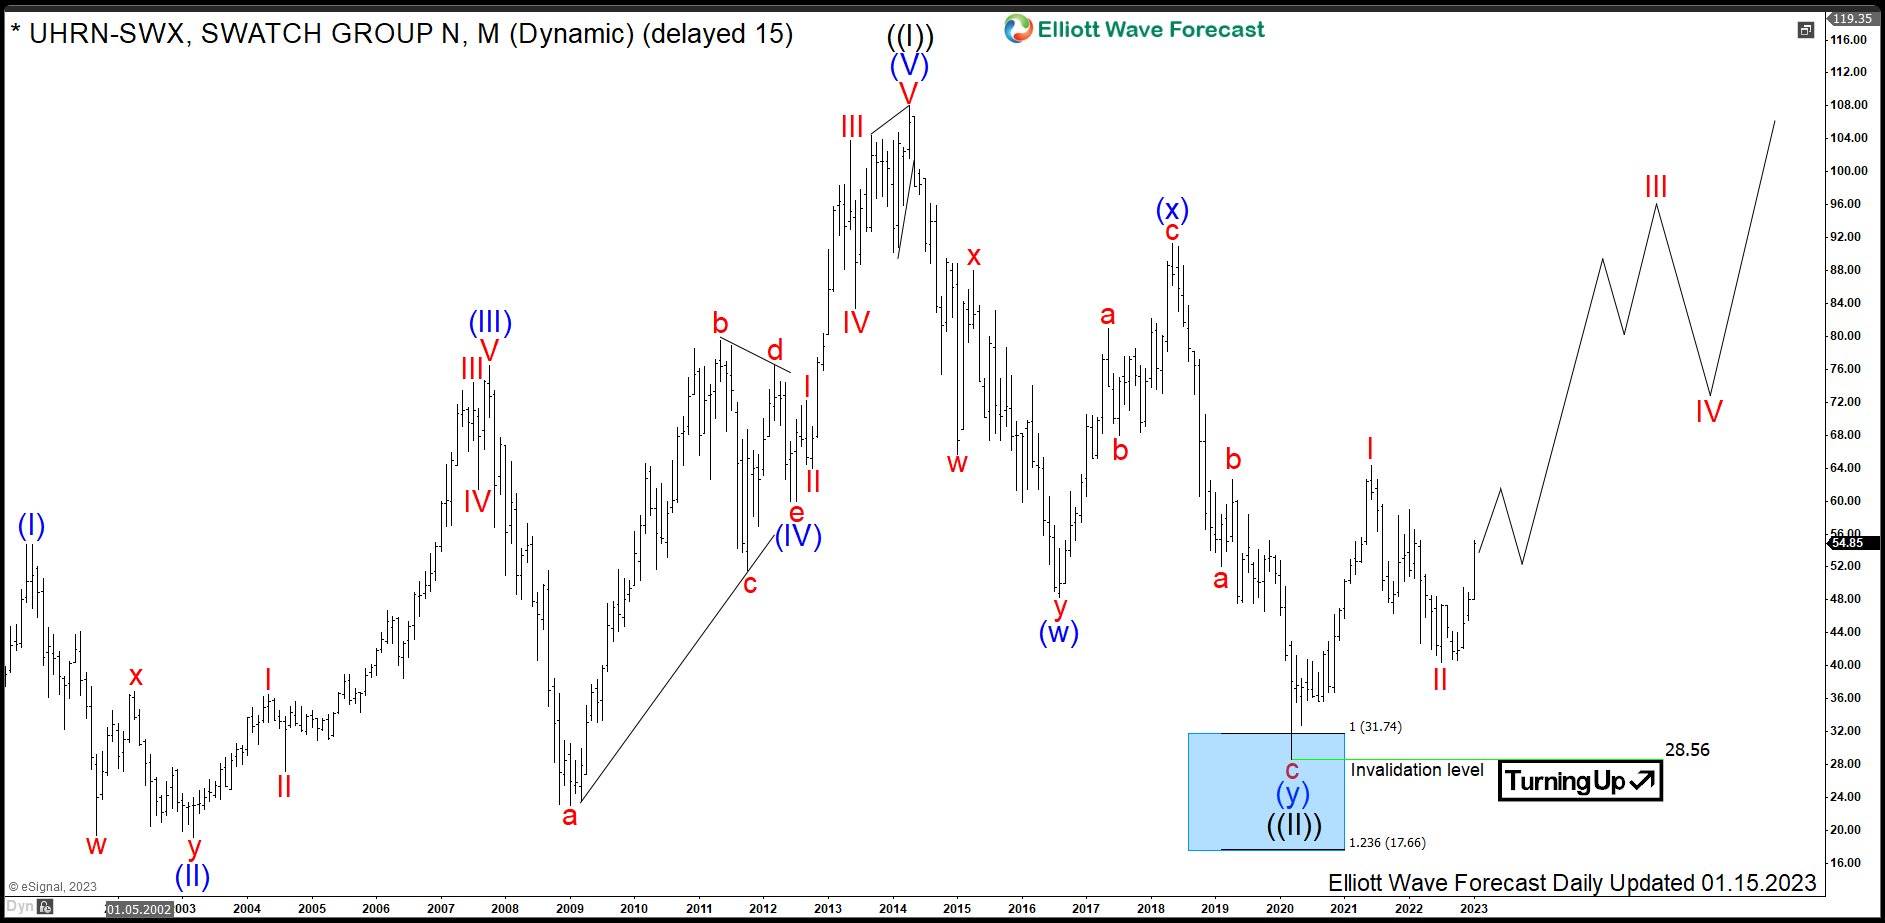
Swatch Monthly Elliott Wave Analysis 01.16.2023
The monthly chart below shows the Swatch stock $UHRN traded at Six Swiss. From the all-time lows, the stock price has developed a cycle higher in wave ((I)) of a grand super cycle degree. Swatch has printed the all-time highs in April 2014 at 108.00. Without any doubt, the advance is a textbook quality impulsive move up in 5 waves. Also, the subdivisions are motive waves, too. From April 2014 highs, a correction lower in wave ((II)) has unfolded as a double three pattern being 3-3-3 structure. It has reached the equal legs extension area towards 31.74-17.66. From that area, a strong reaction higher can be seen. Hereby, Swatch might be in the first stages of a new cycle in black wave ((III)) higher. While above 28.56, Swatch should extend towards the new all-time highs targeting the 135.96-202.34 area and even higher.
Swatch Daily Elliott Wave Analysis 01.16.2023
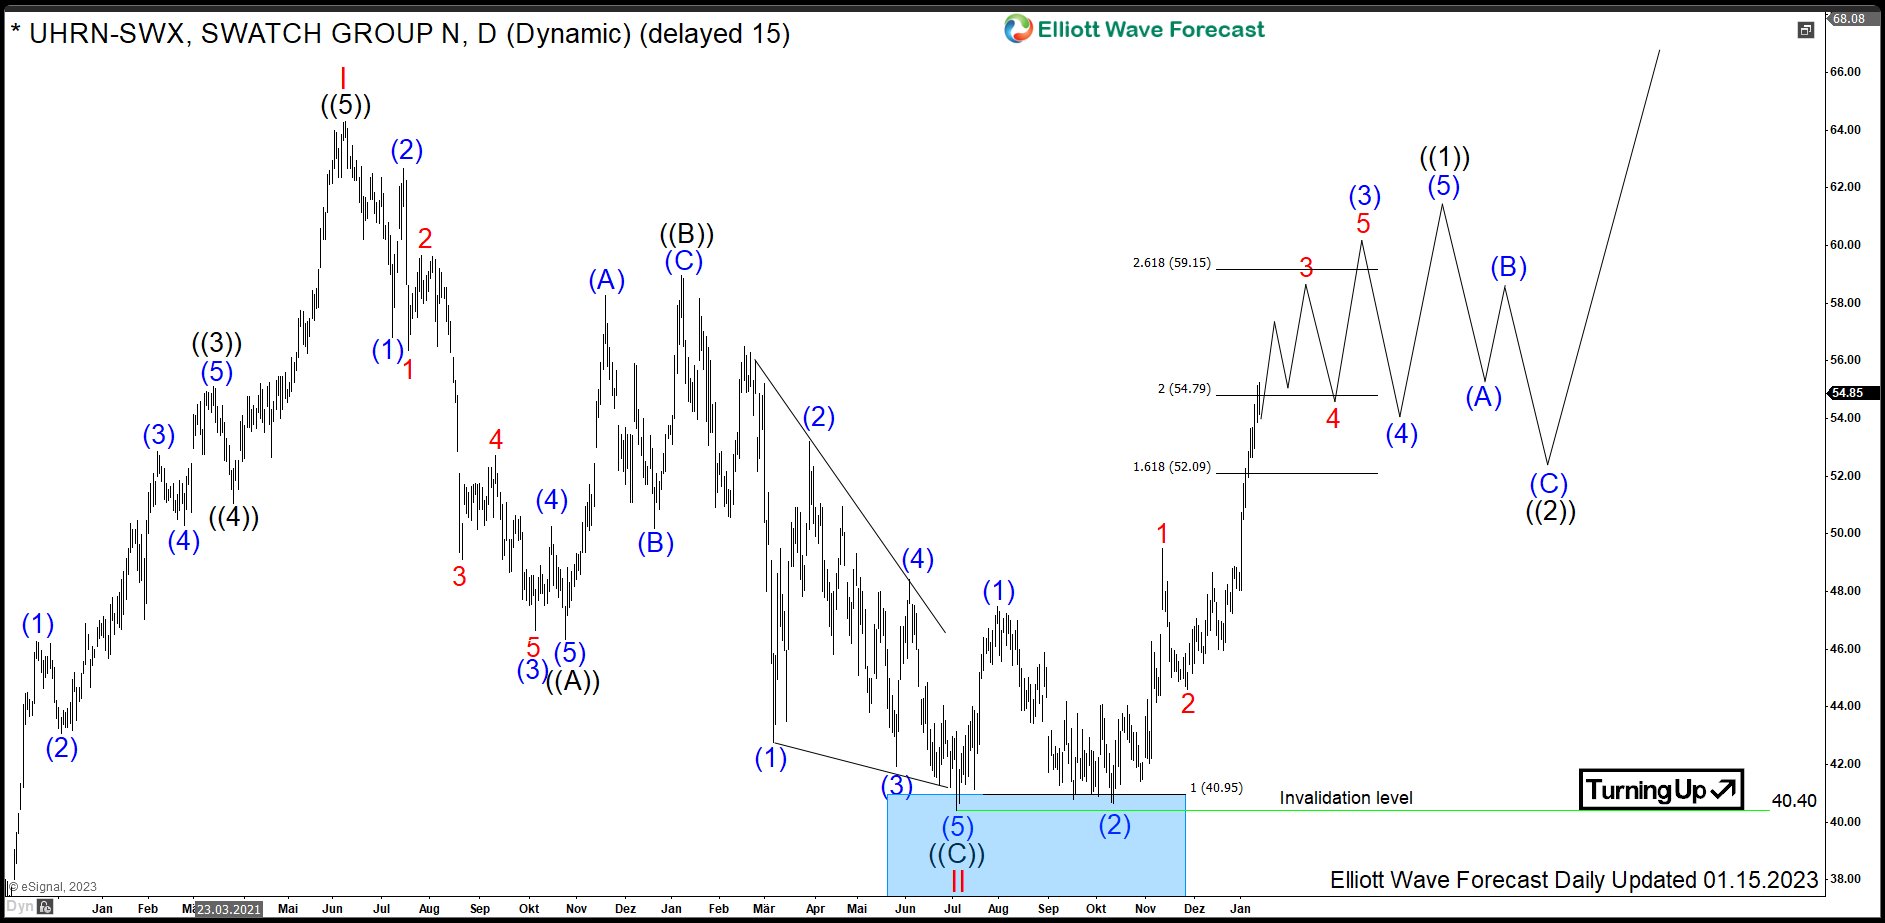
The daily chart below shows the intial nest consisting of red waves I-II of blue wave (I). From the March 2020 lows, red wave I has developed an impuls higher. It has ended in June 2021 at 64.30. From there, a pullback in wave II has unfolded as an Elliott wave zigzag pattern. First, wave ((A)) has ended in October 2021 at 46.32. Then, a connector in wave ((B)) has printed a lower high at 58.95. From there, wave ((C)) has developed an ending diagonal structure. It has reached into 40.95-29.82 buying area. There, in July 2022, a perfect reaction higher has taken place. Investors and traders have been able to go long there.
While above 40.40, expect a rally in wave III targeting in medium term 76.30-98.49 area and even higher. Short-term, blue wave (3) of black wave ((1)) is in progress. It has reached already 2x extension of the blue wave (1). As next, $UHRN can reach 59.15 being the 2.618x extension.
Source: https://elliottwave-forecast.com/stock-market/swatch-starts-mext-rally/