One of the most trending and discussed stocks as of recent is Tesla. People seeing the decline in the stock and not able to understand why it is happening. TSLA has ended a grand degree super cycle. When an instrument ends a larger degree super cycle the pullback usually gets extensive and deep from the lowest lows. Being a member of Elliott Wave Forecast you can see where an instrument stand within the larger degree on the weekly chart. We update those during weekends once a week. Having the befit of knowing where we stand within a cycle should help you make better trading or investment decisions.
Let’s have a look at Tesla back from November until today so you can see how we were forecasting this leg lower within the grand super cycle. It’s crucial to understand that markets move within cycles and nothing moves in one direction without a pullback. As investors and traders have to take profits. At Elliott Wave Forecast we have developed a system that allows us to see the market in a unique way not based only on traditional Elliott Wave counts. We use market correlations, distribution and sequences to determine a cycle and a possible path. In addition we know that the market nowadays is traded by high frequency machines. We are able to calculate areas which a reaction is highly likely to take place.
TSLA 11.09.22 4 Hour chart
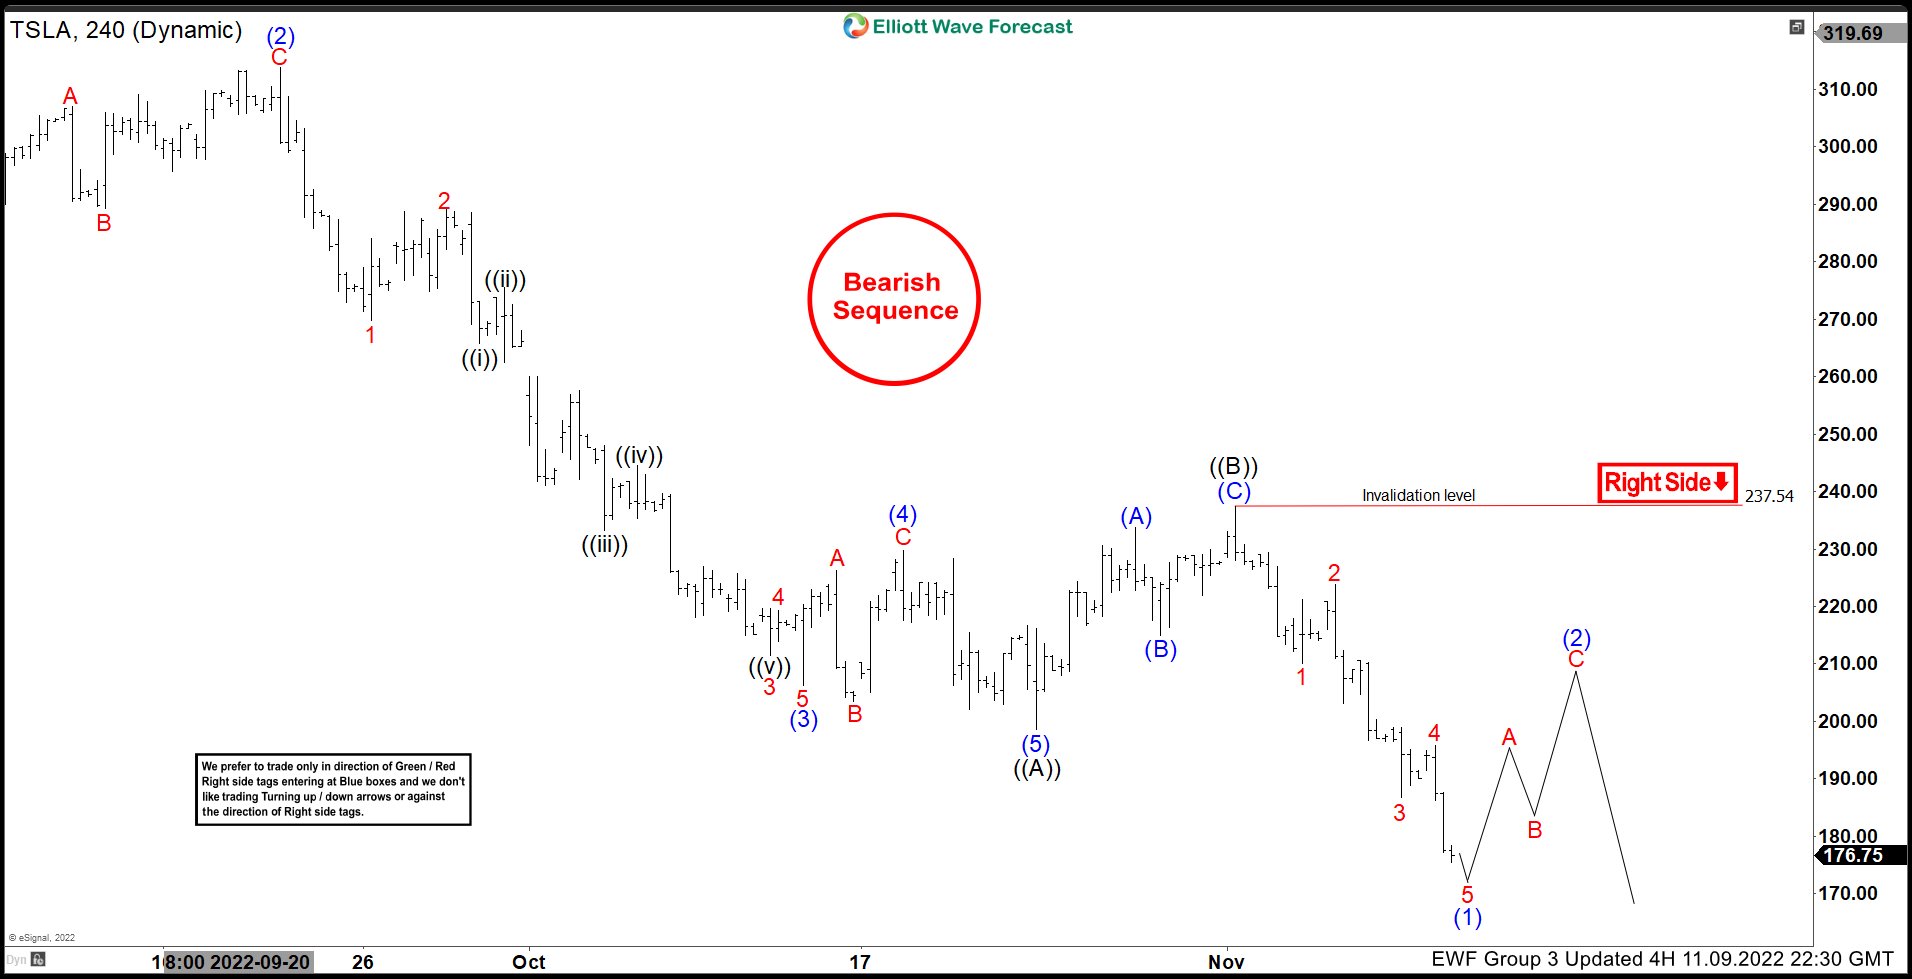
We have a bearish sequence here in TSLA with a connector at 237.54 end calling the first wave lower in (1) to be underway. More downside expected after wave (2) bounce staying below 237.54.
Now let’s have a look at TSLA as of latest 4 hour chart.
TSLA 12.29.22 4 Hour chart
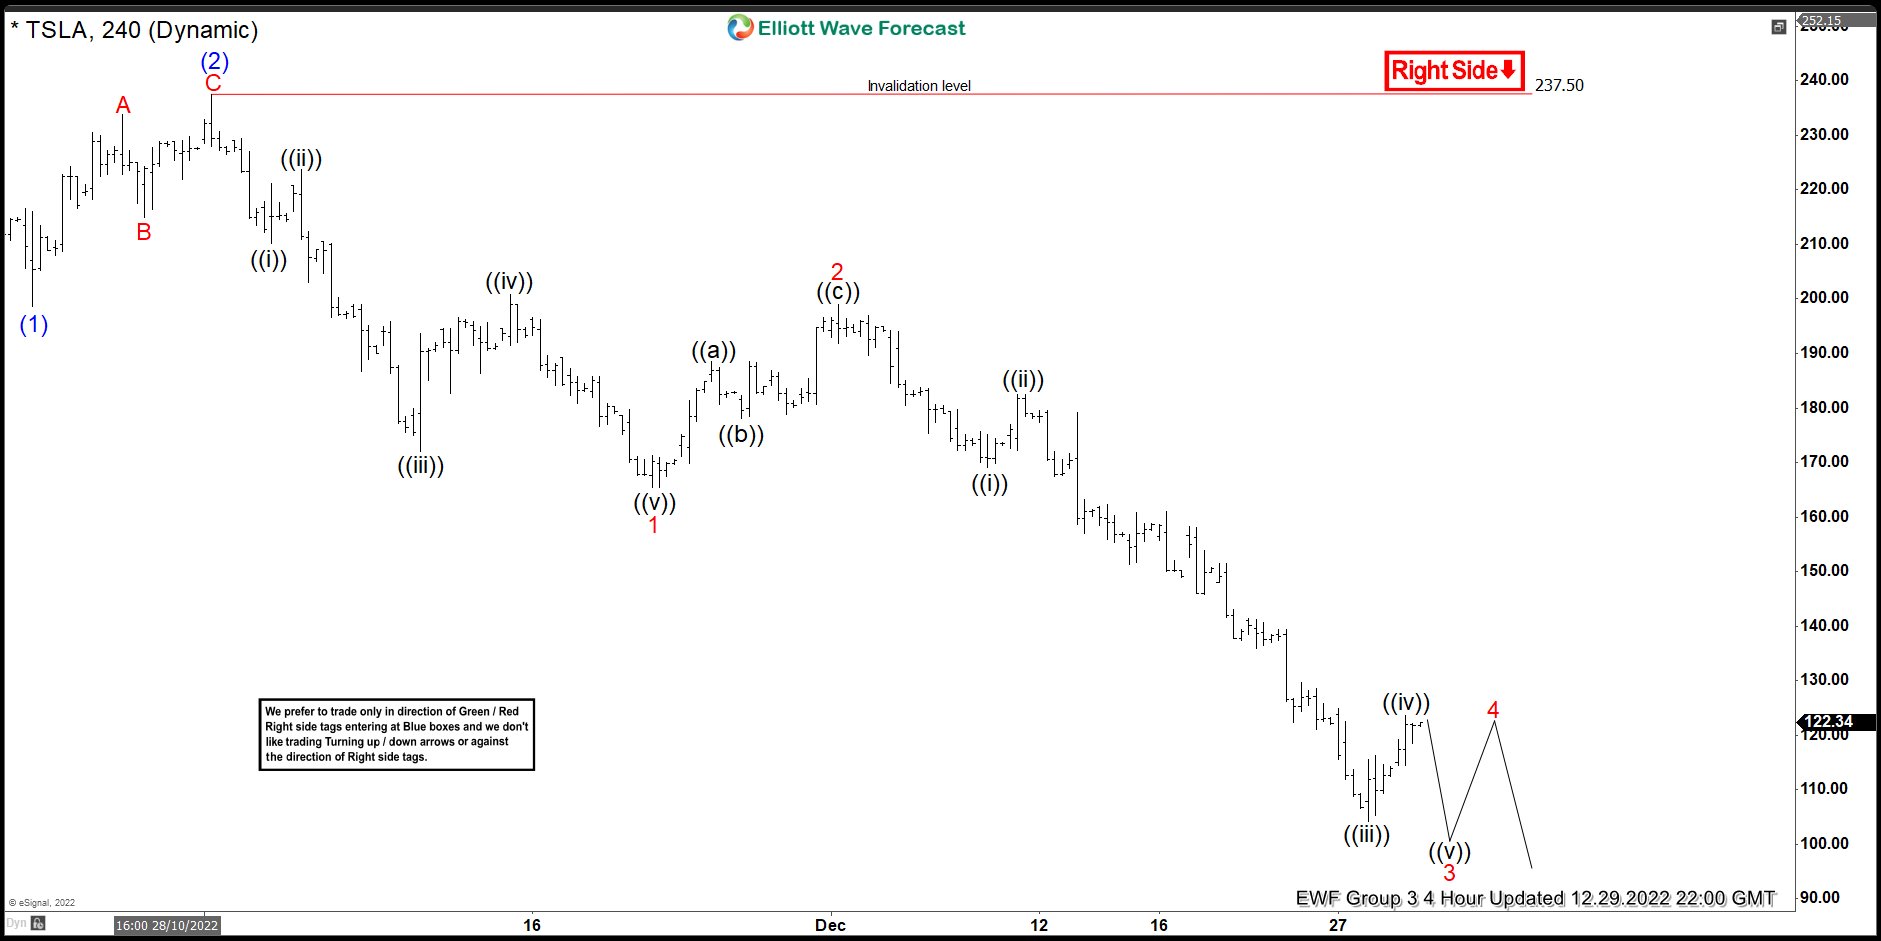
We can see how nicely the market reacted lower within the wave (3). Currently it is trading within wave 3 in red. This means soon we will be getting a bounce in wave 4 before another leg down in wave 5 to end larger degree wave (3).
Source: https://elliottwave-forecast.com/stock-market/tsla-forecasting-the-decline-in-tesla-from-november/