Gold and related miners continue to suffer a setback as the Fed continues its aggressive rate hike to combat inflation. However, there’s recent indication that the world’s central banks may reduce the pace of the hike due to the rising probability of a recession. In this update, we will look at the technical outlook in Gold Miners Junior (GDXJ). We will use Elliott Wave to do the analysis.
GDXJ Monthly Elliott Wave View
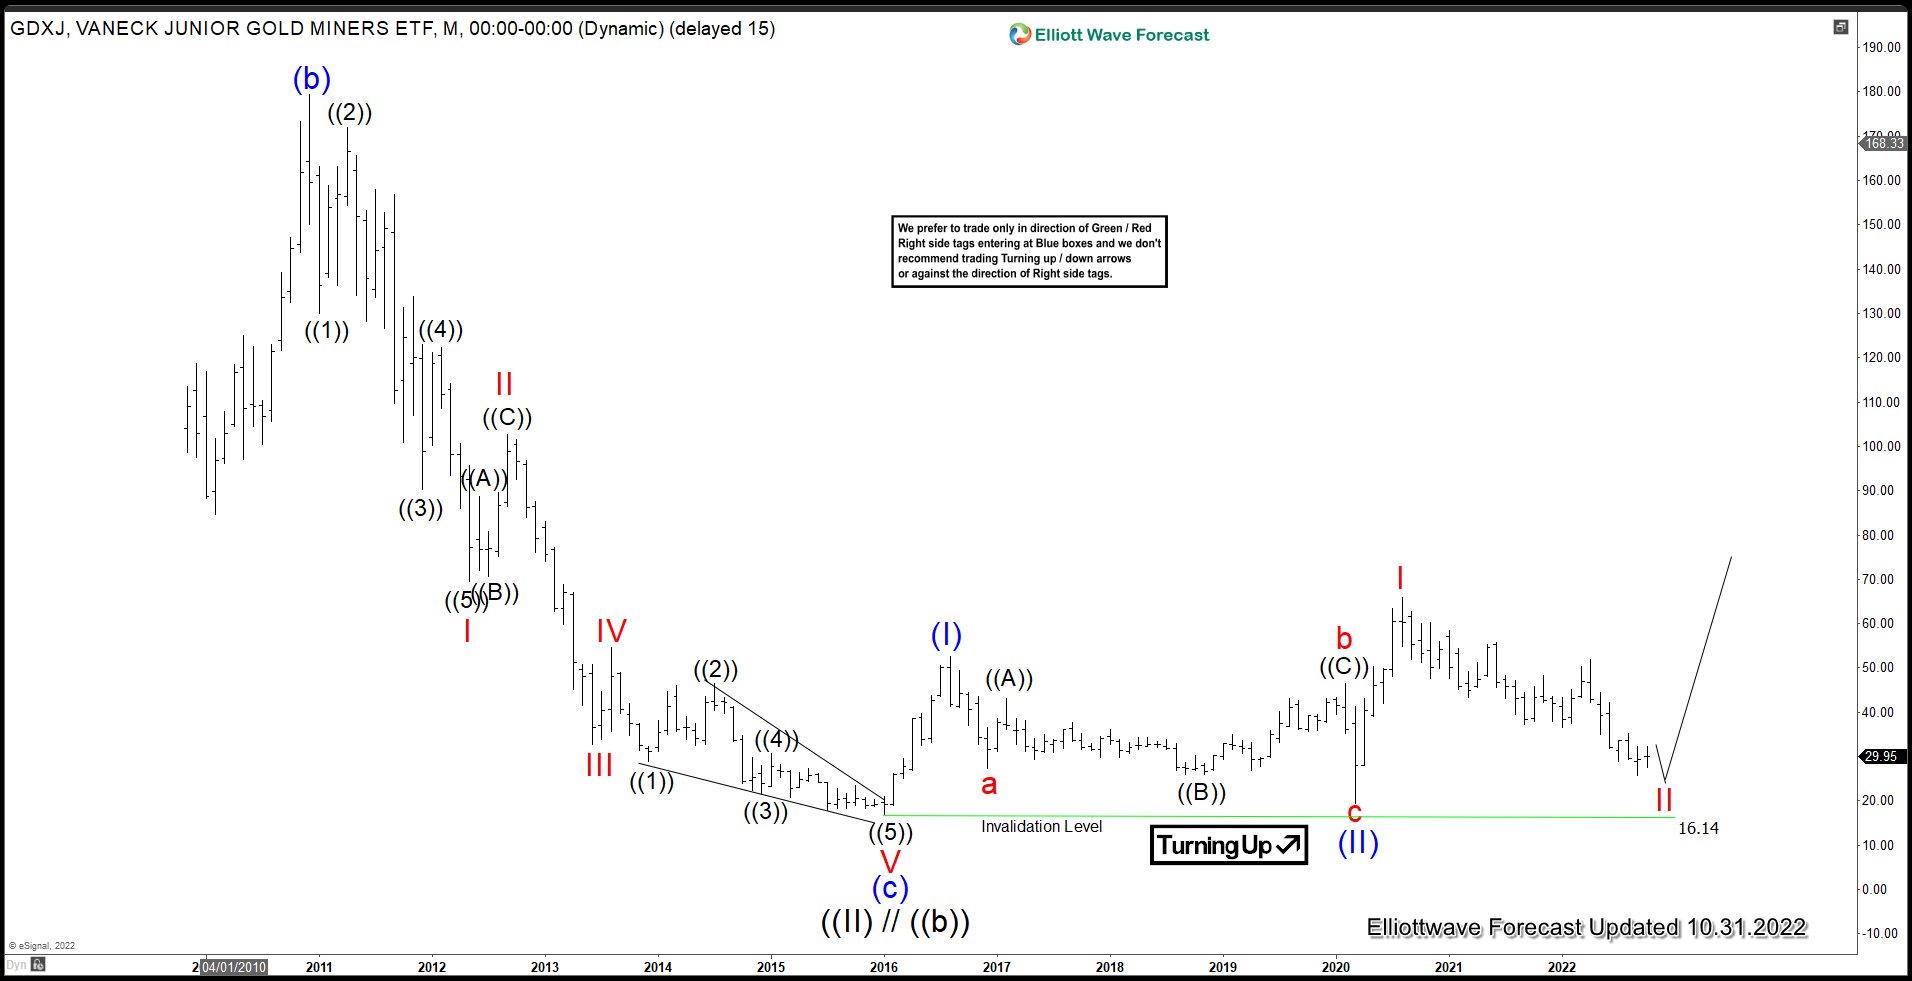
Monthly Elliott Wave chart for GDXJ (Junior Gold Miners ETF) above shows that wave ((II)//((b)) pullback has ended at $16.14 on January 2016 low. Up from there, wave (I) ended at $52.50 and pullback in wave (II) ended at $19.52. The ETF has resumed higher in wave (III). Up from wave (II), wave I ended at $65.95. Wave II pullback is in progress to correct cycle from 3.16.2020 low in 3, 7, or 11 swing before the rally resumes. While pivot at 19.4 low stays intact, expect the ETF to soon end wave II and resume higher.
GDXJ Daily Elliott Wave View
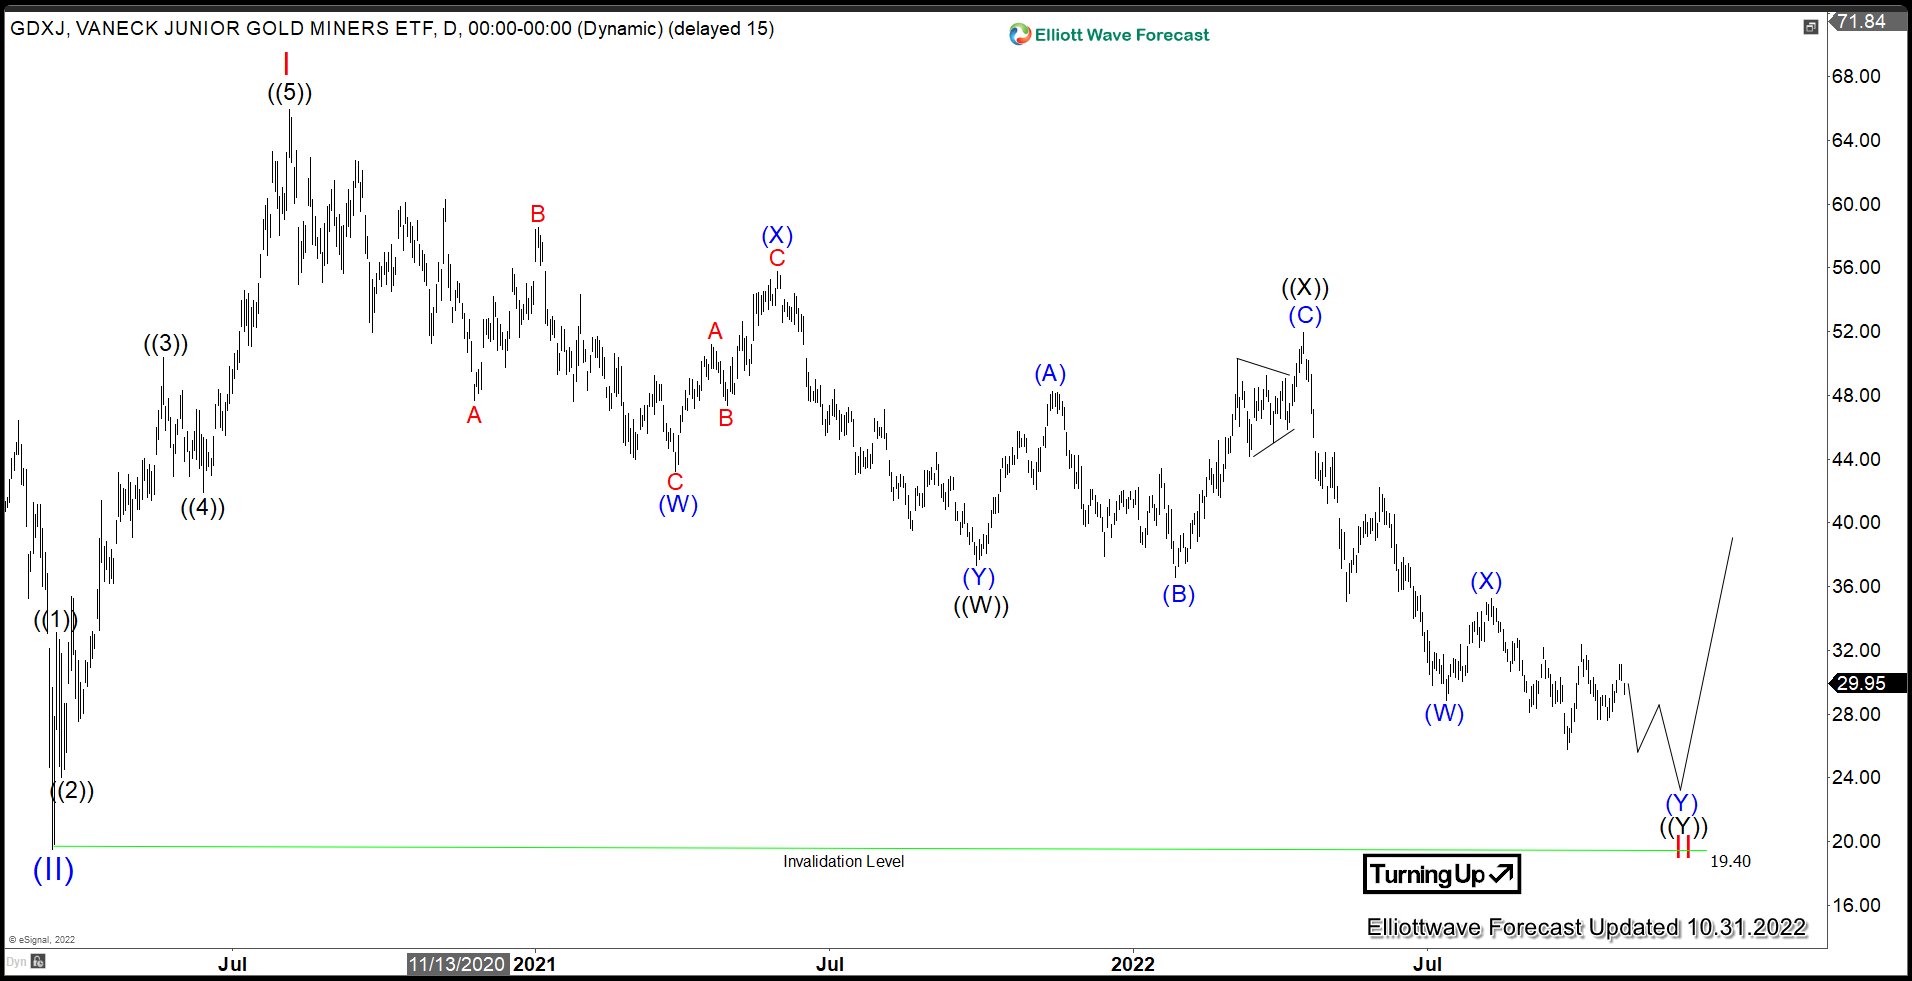
Daily Elliott Wave Chart of GDXJ above shows that wave II pullback is in progress as a double three Elliott Wave structure. Down from wave I, wave (W) ended at $43.24, wave (X) rally ended at $55.79, and wave (Y) ended at $37.31. This completed wave ((W)). Rally in wave ((X)) ended at $51.92 with internal subdivision as expanded flat. Wave ((Y)) lower is in progress and can retest $19.40 low before the ETF resumes higher. While pivot at 19.40 stays intact, expect the ETF to soon form the bottom in wave II and turns higher.
Source: https://elliottwave-forecast.com/stock-market/gdxj-looking-form-bottom/