Hello fellow traders. In this technical blog we’re going to take a quick look at the Elliott Wave charts of 10 Year Note. As our members know, ZN_F has been giving us good trading opportunities recently. We have explained trading setup in our previous technical article on 10 Year Note. In this blog we are going to take a look at short term H1 charts and explain what we expect in near term.
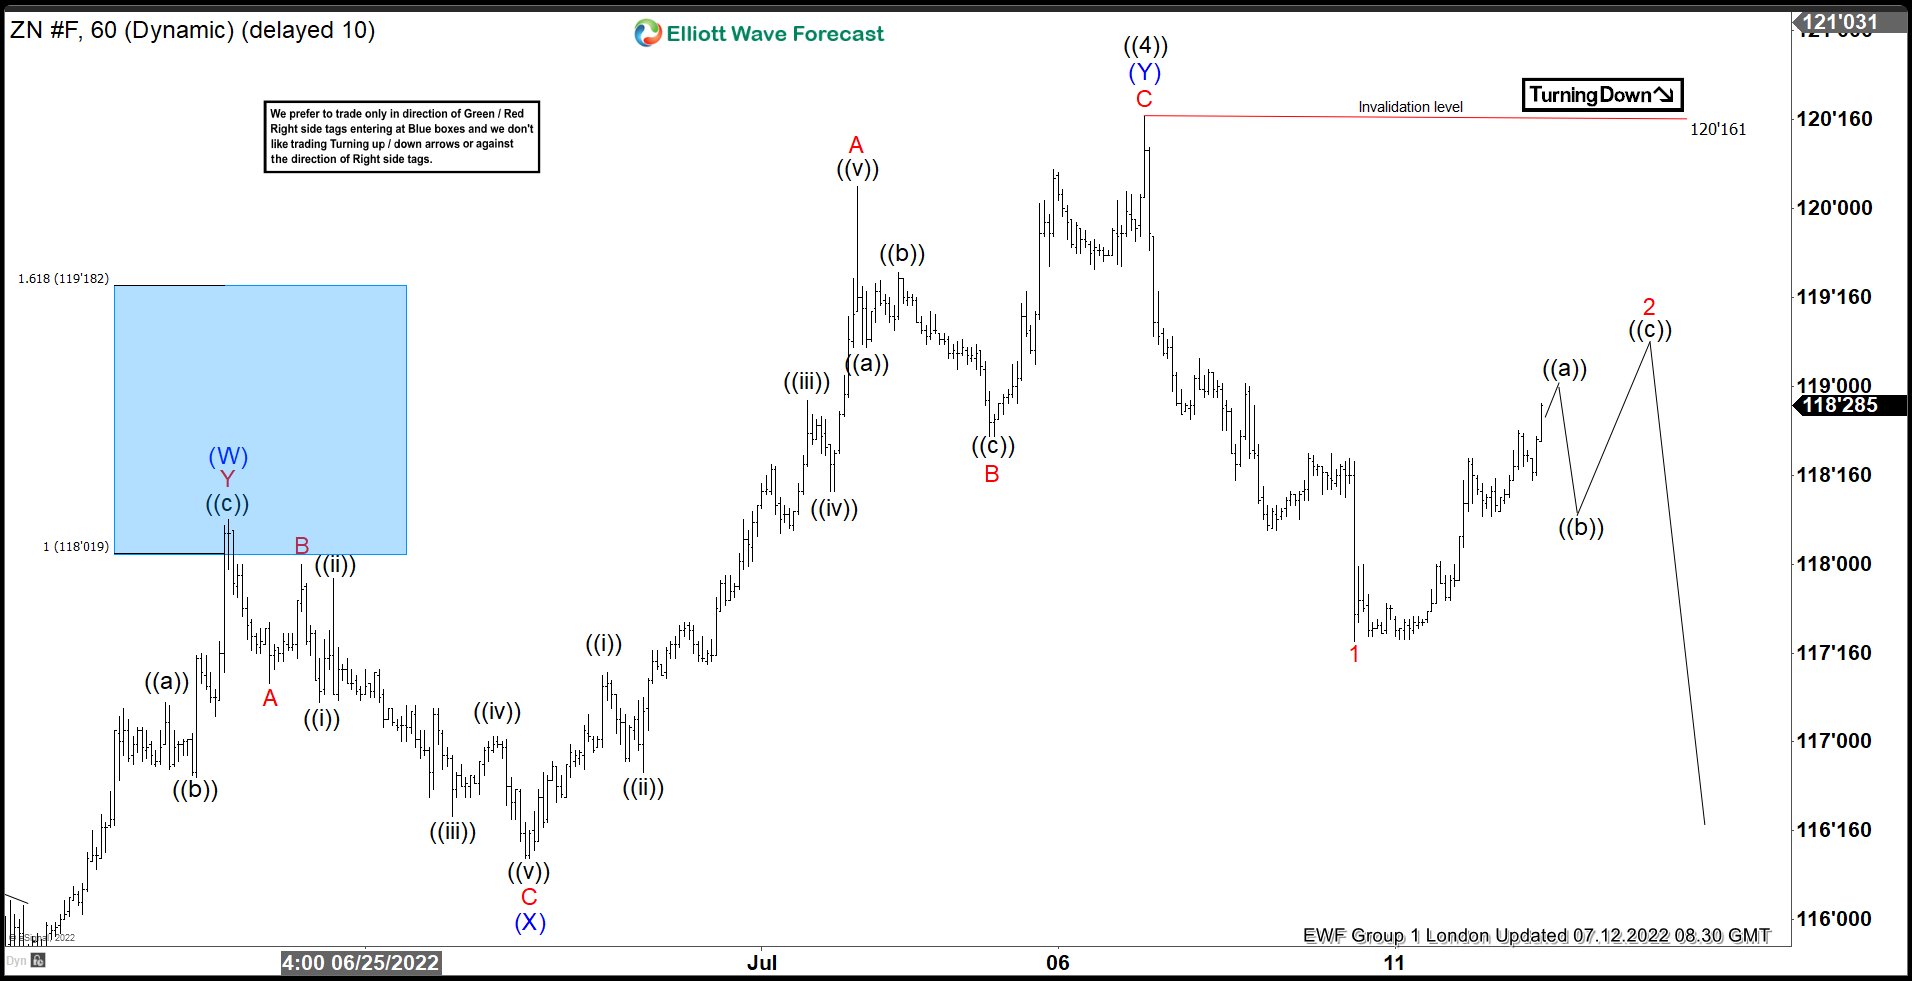
10 Year Note ZN_F H1 Elliott Wave Analysis 07.12.2022
ZN_F reached our selling zone at 120’12-122’28. and gave us nice reaction from there. Wave ((4)) recovery ended at 120’16. As far as the price stays below that peak , we can be trading lower in ((5)) black toward 112’23-110’1 area. Now, we are getting short term recovery 2 red against the 120’16 peak. Current view suggests we are ending only first leg ((a)) black of 2 red. After short term pull back we should ideally see another leg up before further decline resumes.
Reminder: You can learn about Elliott Wave Patterns at our Free Elliott Wave Educational Web Page.
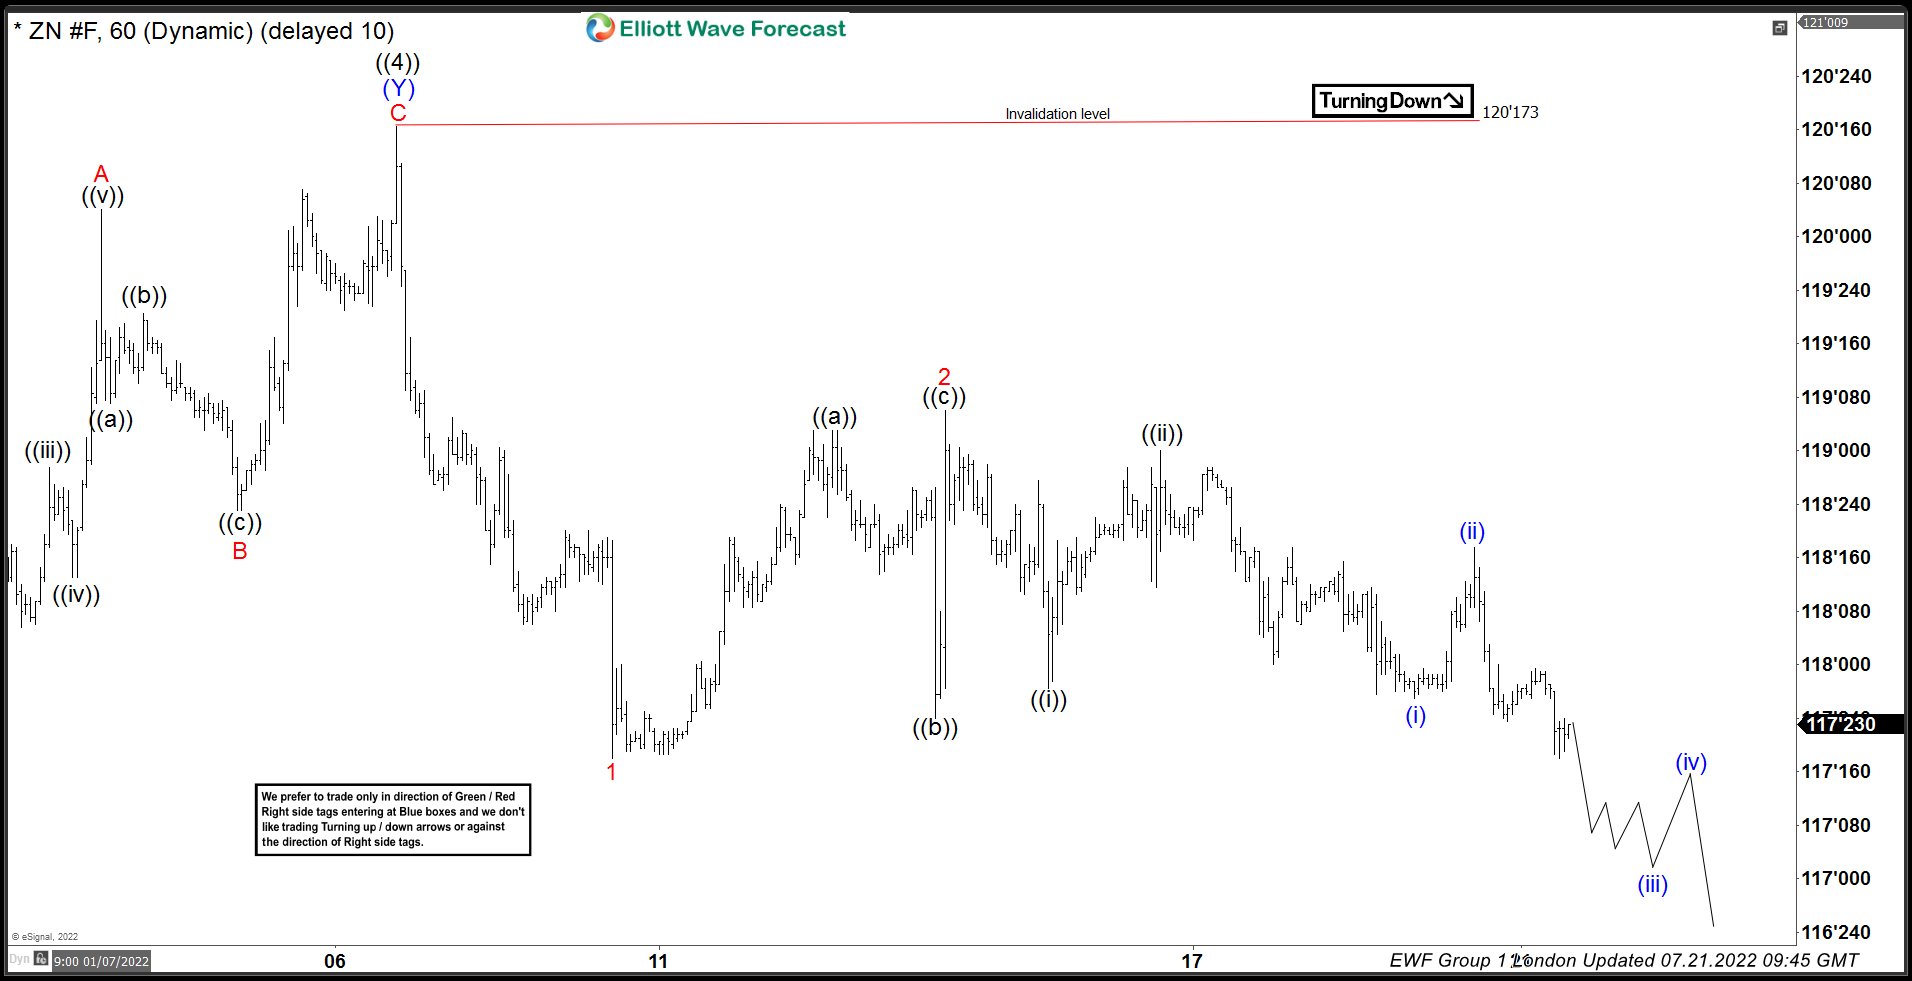
ZN_F H1 Elliott Wave Analysis 07.21.2022
10 Year Note ZN_F Given us 3 waves bounce in 2 red as expected. Correction ended at 119’05 and now trading lower. We would like to see break below 1 red low-07/08 to confirm 3 red is in progress. As far as the price stays below 119’05 , next short term tech zone to the downside comes at 116’1-115’2
Keep in mind market is dynamic and presented view could have changed in the mean time. You can check most recent charts in the membership area of the site. Best instruments to trade are those having incomplete bullish or bearish swings sequences.We put them in Sequence Report and best among them are shown in the Live Trading Room.
Elliott Wave Forecast
Source: https://elliottwave-forecast.com/trading/10-year-note-elliott-wave-bounce/