
The S&P/TSX is a major stock market index which tracks the performance of largest companies by market capitalization on the Toronto Stock Exchange in Canada. It is a free float market capitalization weighted index. The index covers approximately 95 percent of the Canadian equities market. The S&P/Toronto Stock Exchange Composite Index has a base value of CAD1000 as of January 1, 1975.
TSX Daily Chart July 1rt 2022
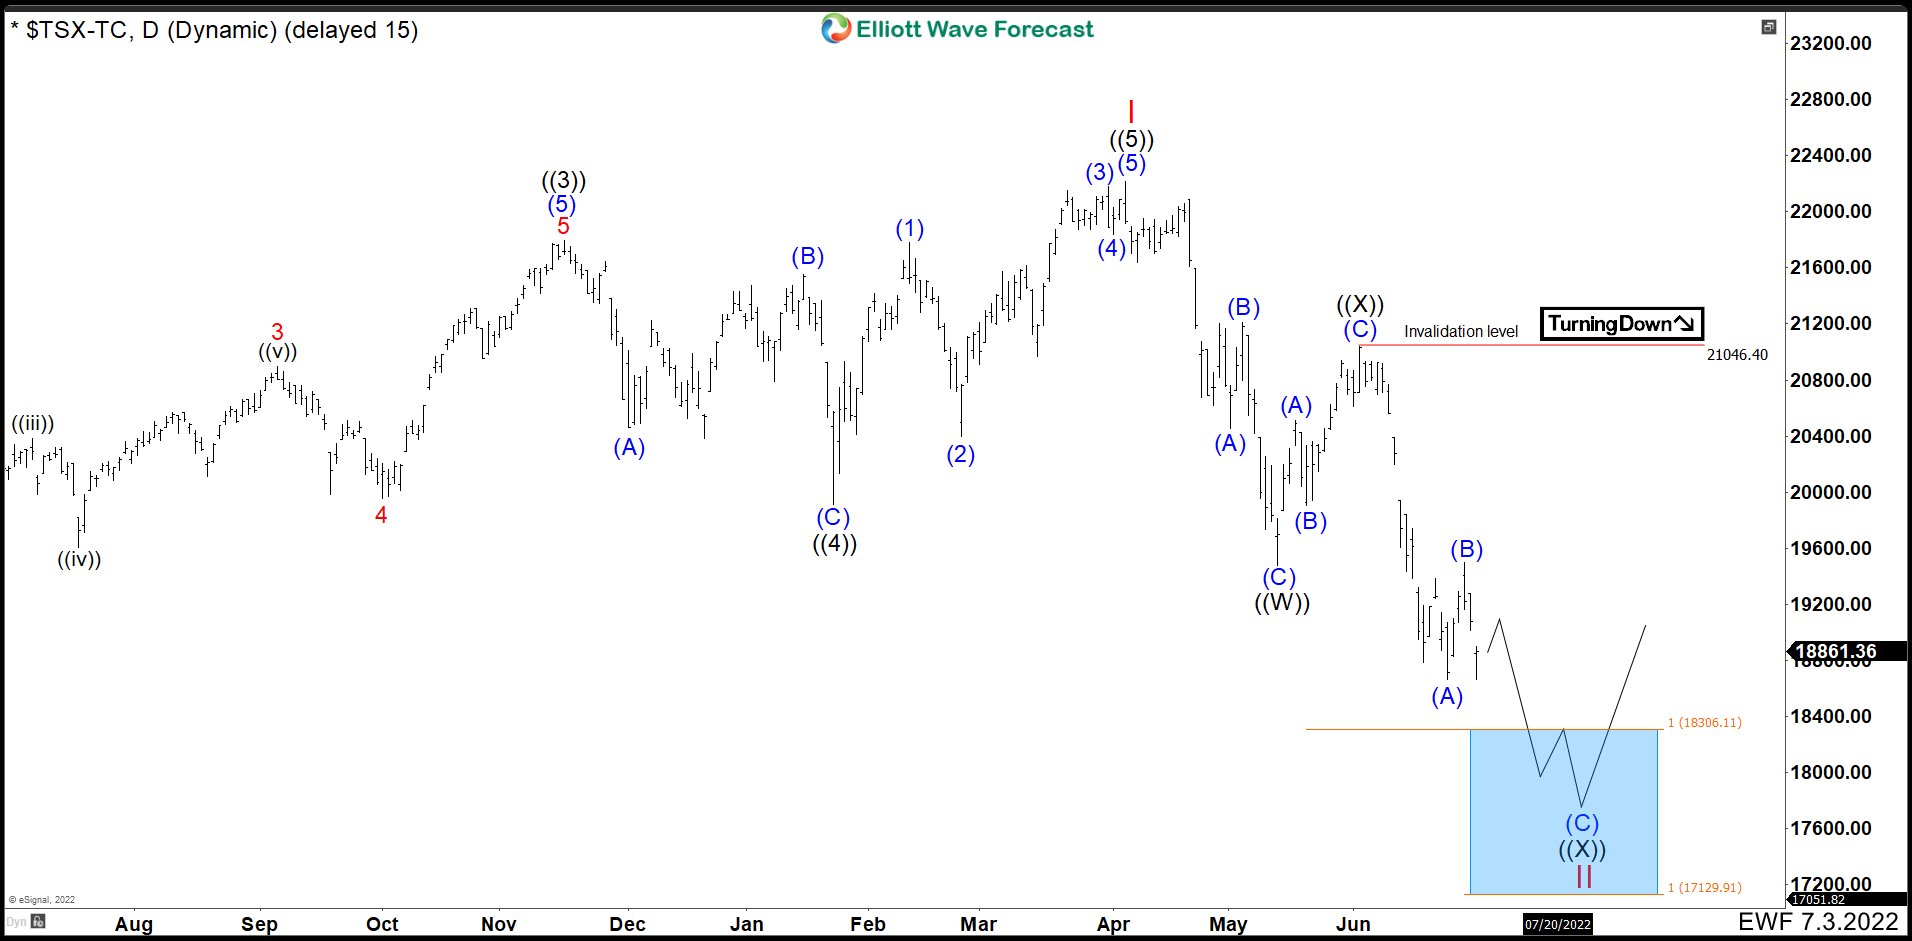
The Canadian TSX index ended an impulse from the March 2020 lows and It is correcting this cycle. The pullback has taken the form of a double correction. This means that the market must make 7 swings to complete the whole structure. (If you want to learn more about Elliott Wave Theory, please follow these links: Elliott Wave Education and Elliott Wave Theory).
From 22219 peak, TSX index fell forming an impulse ending wave (A) at 20453. Wave (B) bounced back and ended at 21223. Then we had another push down to complete wave (C) and the first 3 swings as ((W)) at 19471. The fourth swing or connector wave ((X)) rallied in 3 waves ending at 21046.
From wave ((X)) we need 3 more swings to complete the double correction. We had another impulsive structure as wave (A) ending at 18657. Then a short bounce as wave (B) ending at 19497 and continued down.
Currently, we are in the last swing to complete the double correction. We expect to build an impulse or ending diagonal to complete the structure. The ideal zone to end the cycle is given in 18306 – 17129 area. From here, we expect to continue with the rally that breaks 22219 peak or see 3 swings upwards at least.
Source: https://elliottwave-forecast.com/stock-market/index-tsx-double-correction/