In this technical blog, we will look at the past performance of 1 hour Elliott Wave Charts of XME ETF. In which, the decline from 08 June 2022 high unfolded as an impulse sequence and showed a lower low sequence within the cycle from the April peak. Therefore, we knew that the structure in XME is incomplete to the downside & should see more weakness. So, we advised members to sell the bounces in 3, 7, or 11 swings at the blue box areas. We will explain the structure & forecast below:
XME 1 Hour Elliott Wave Chart
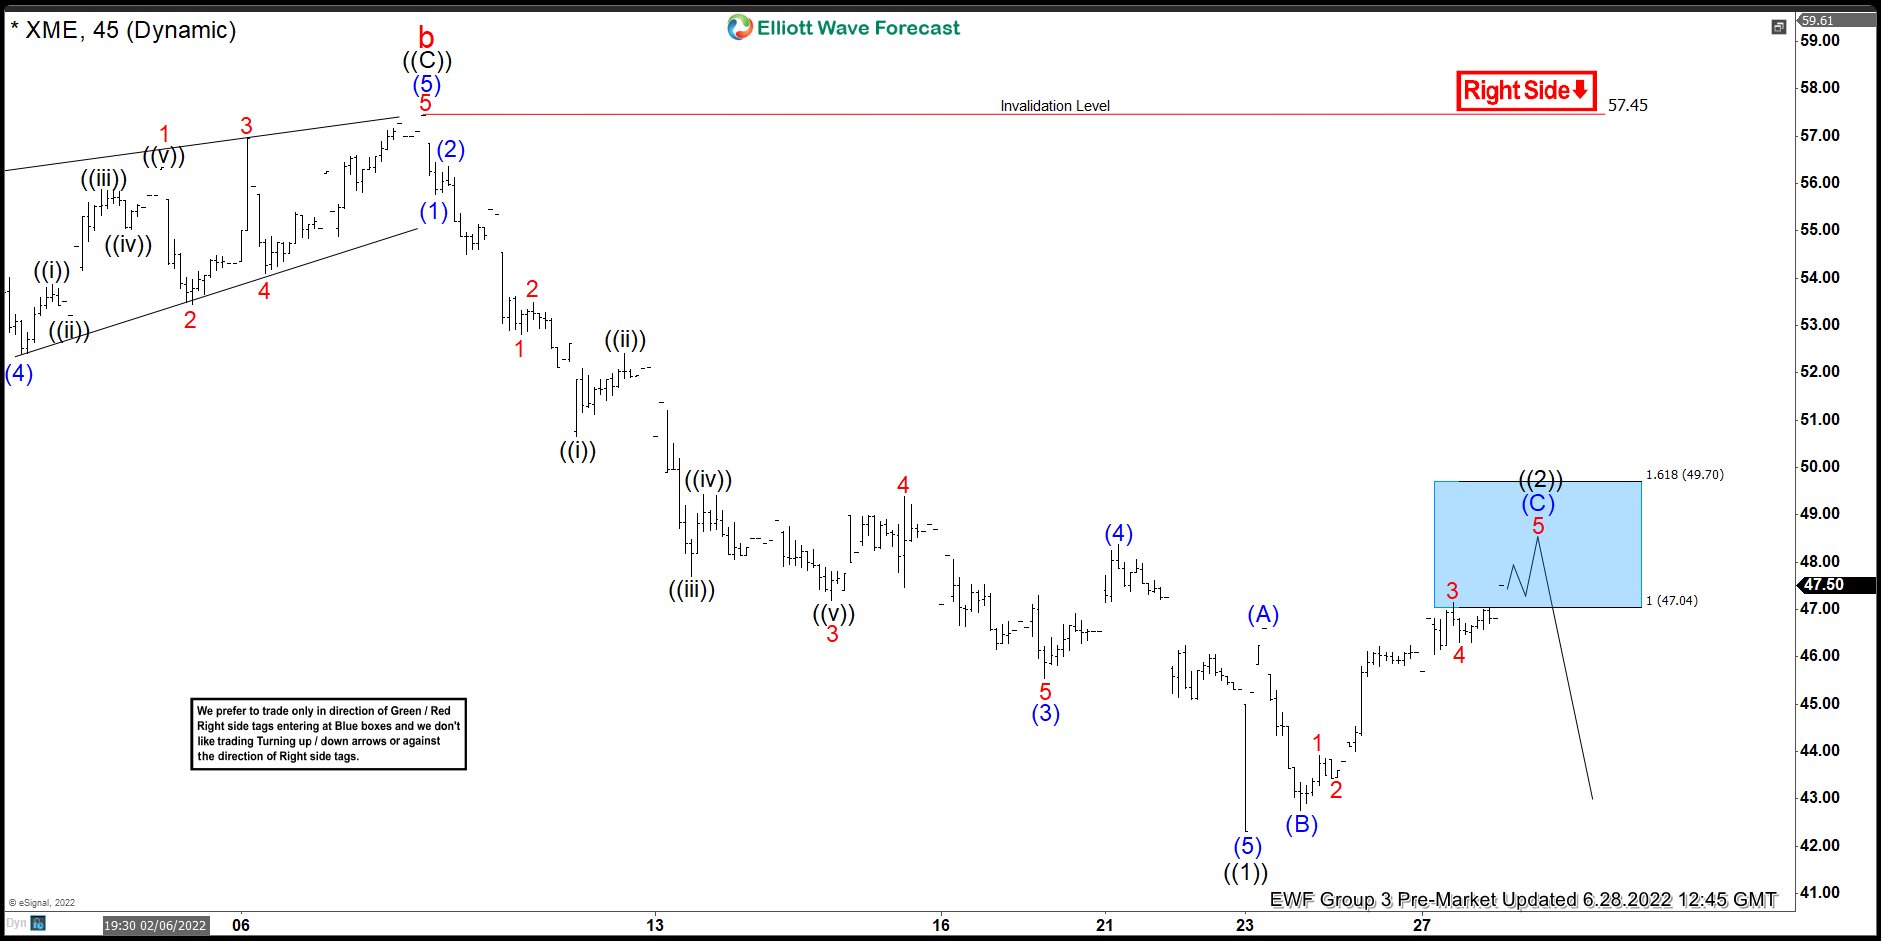
Here’s 1hr Elliott wave Chart from the 6/28/2022 Pre-Market update. In which, the decline to $42.32 low ended 5 waves from 6/08/2022 high in wave ((1)) & made a bounce in wave ((2)). The internals of that bounce unfolded as an Elliott wave zigzag correction where wave (A) ended at $46.60 high. Then a pullback to $42.76 low ended wave (B) pullback and started the (C) leg higher towards $47.04- $49.70 blue box area from where sellers were expected to appear looking for more downside or for a 3 wave reaction lower at least.
XME Latest 1hr Elliott Wave Chart
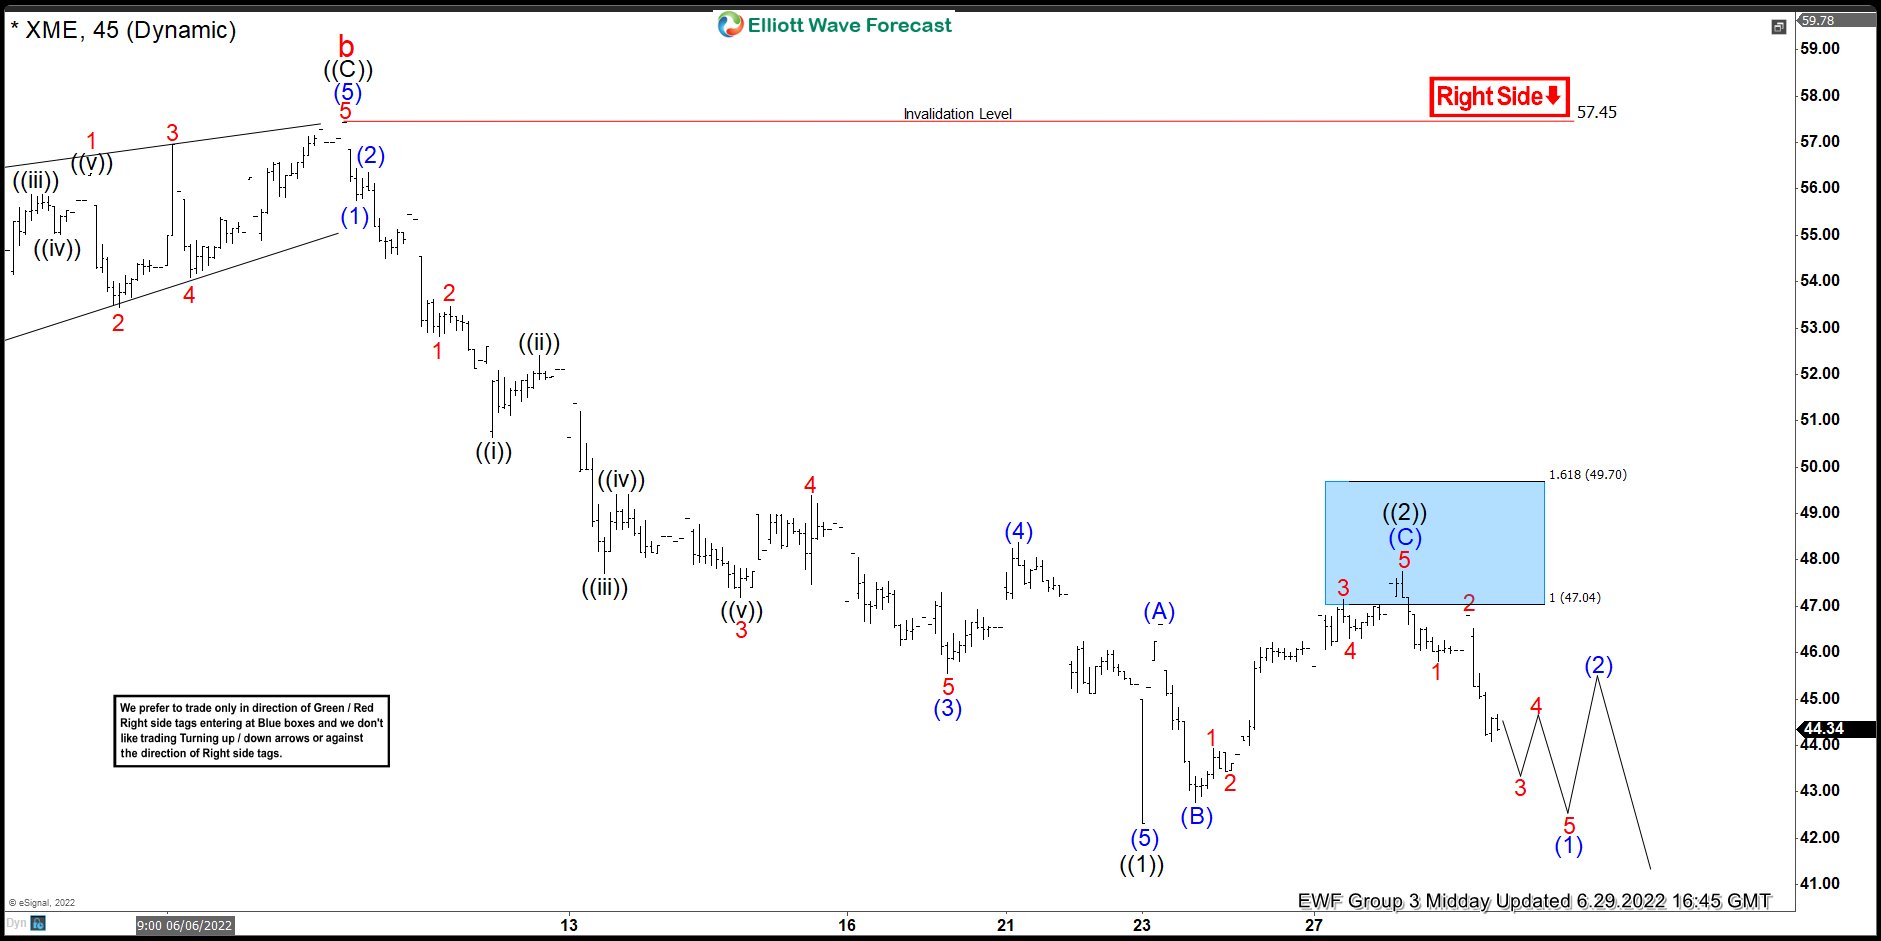
This is the 1hr view from the 6/29/2022 Midday update. In which the ETF is showing a reaction lower taking place from the blue box area allowing shorts to get into a risk-free position shortly after taking the position. However, a break below $46.60 low is still needed to confirm the next extension lower & avoid double correction higher.
Source: https://elliottwave-forecast.com/stock-market/xme-reacting-strongly-blue-box-area/