
The Gold to Silver Ratio (AUG) is always a good indicator of the path of commodities and the $USDX. The ratio found sellers on March.2020, and the peak agrees with the peak in the $USDX back in 03.2020. As we can see, the Ratio did a five waves decline, and now it is correcting in three waves pullback.
Monthly Gold-to-Silver Ratio Elliott Wave Chart
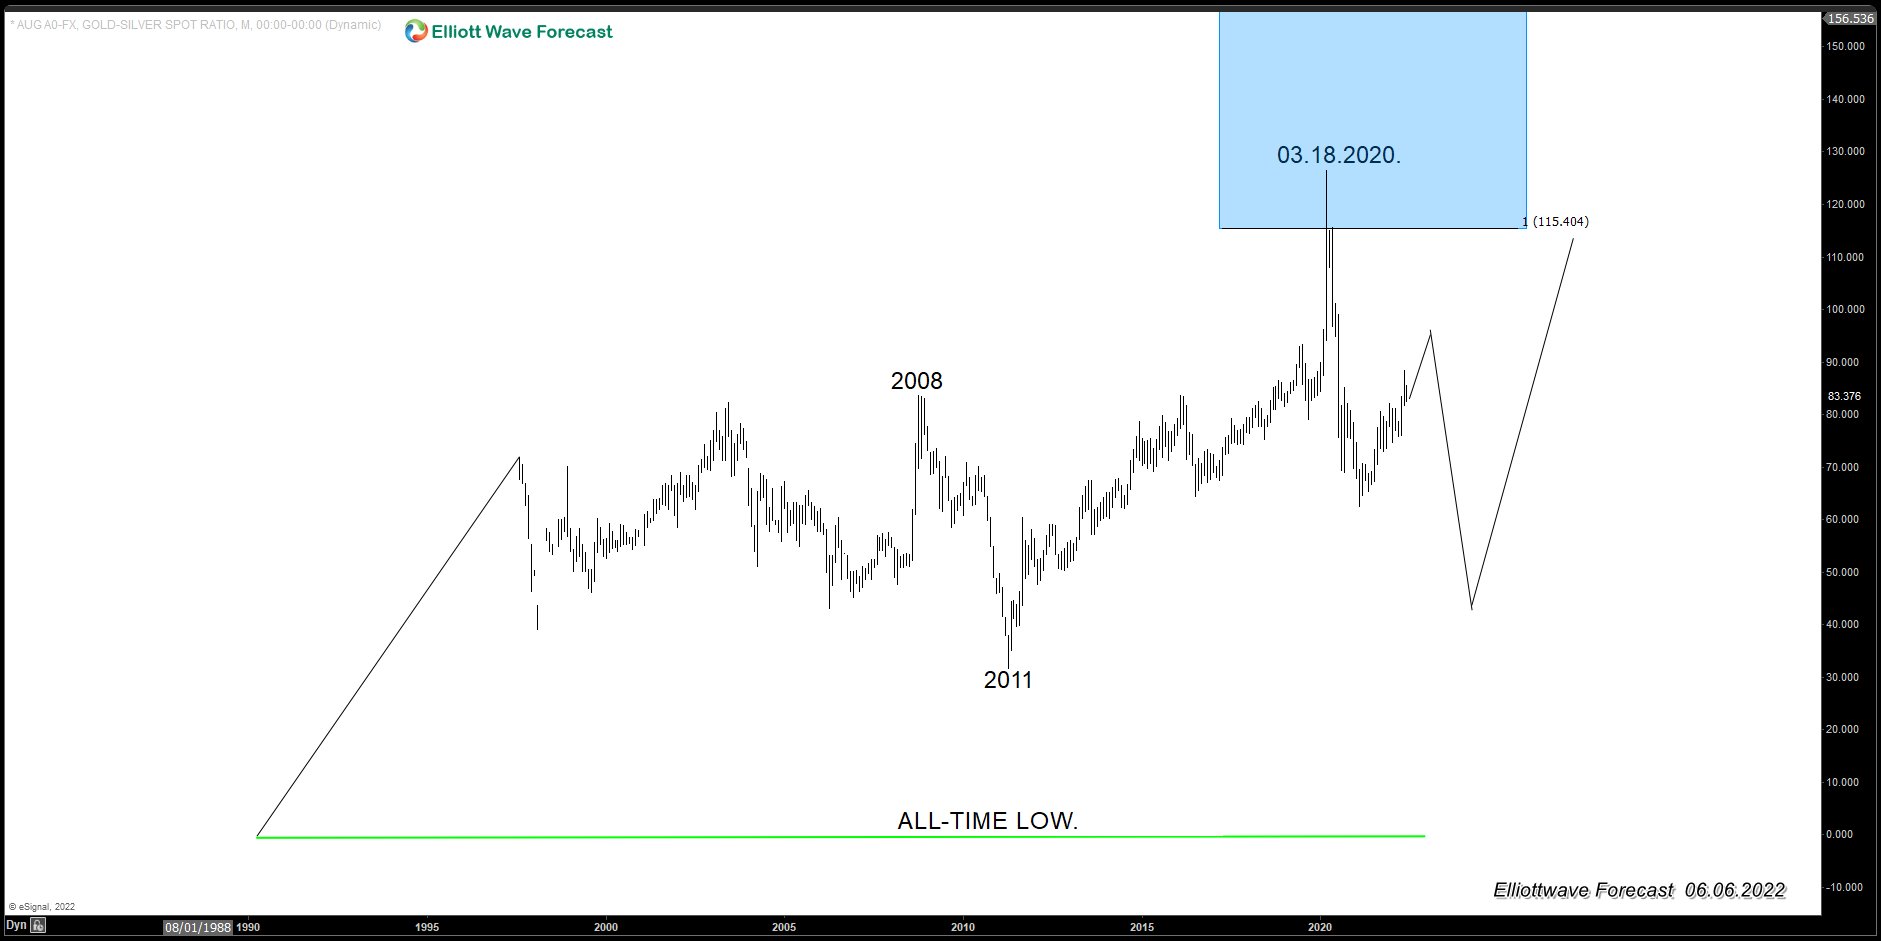
The rally in the ratio reflects the Grand Super Cycle from the all-time lows and reached the blue box area. The Ratio then reacted lower, and now is bouncing in three waves. Afterwards, we should expect the Ratio to drop lower and re-test the all-time lows. The idea will make the $USDX going down and YEN pairs going up. The swing lower in the Ratio will make Silver test the all-time highs. We at EWF always correlate the market and try to make sense of the correlation either in the first or second degree.
5 Waves Impulse in Elliott Wave Theory
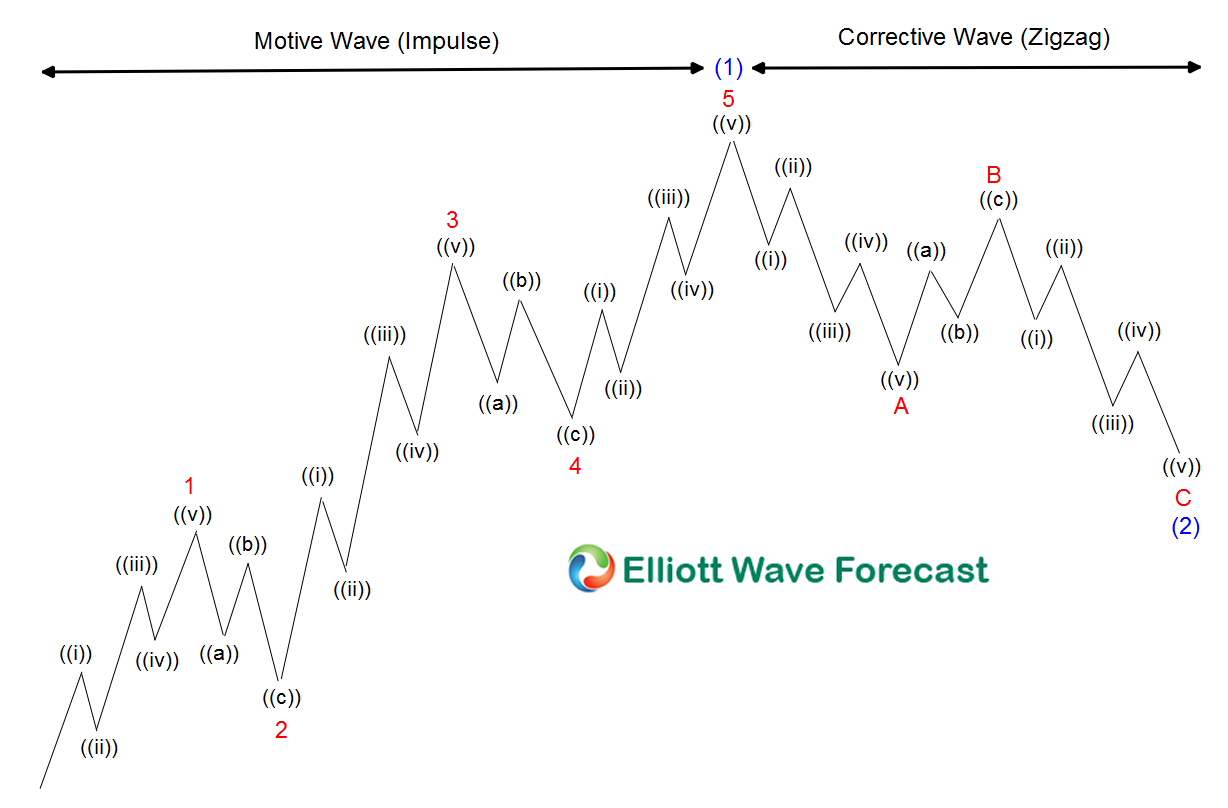
The graphic above reflects the classic Elliott Wave Theory pattern in which the market advances in five waves and corrects in three waves. As we can see, this pattern repeats itself. The larger ABC correction subdivides into 5-3-5, in which each leg comes in a sequence of five waves.
The decline in the Ratio from the peak in 03.2020 shows a clear five waves decline, and now it is in the process of a three waves pullback of ABC.
Gold-to-Silver Ratio Daily Elliott Wave Chart
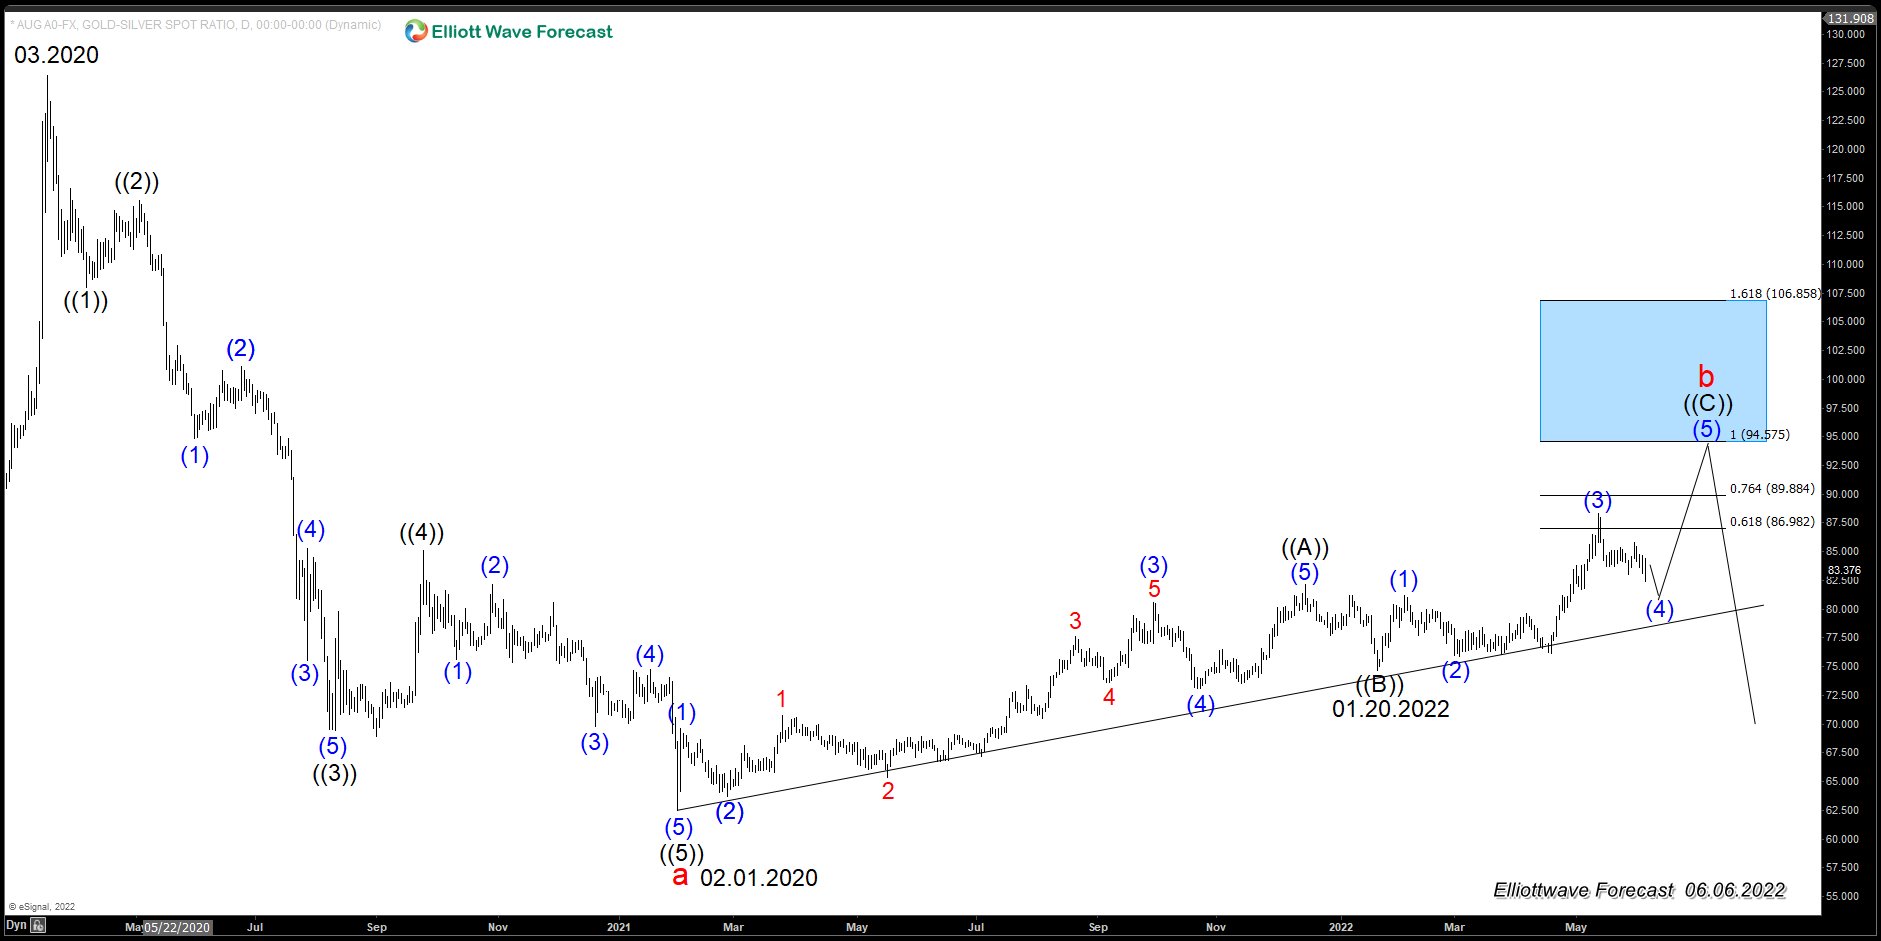
The chart above shows five waves down from March 2020 peak and in the process of the three waves’ pullback. As we can see, the blue box area has not yet been reached, and another swing higher in the Ratio can still happen. This wing higher will make Silver trade lower. Presently, the Ratio should be in wave (4), and soon buyers will be entering the market for another leg up. Short term, this will present an opportunity to sell commodities like Silver and Gold among others.
Gold-to-Silver Ratio 4 Hour Elliott Wave Chart
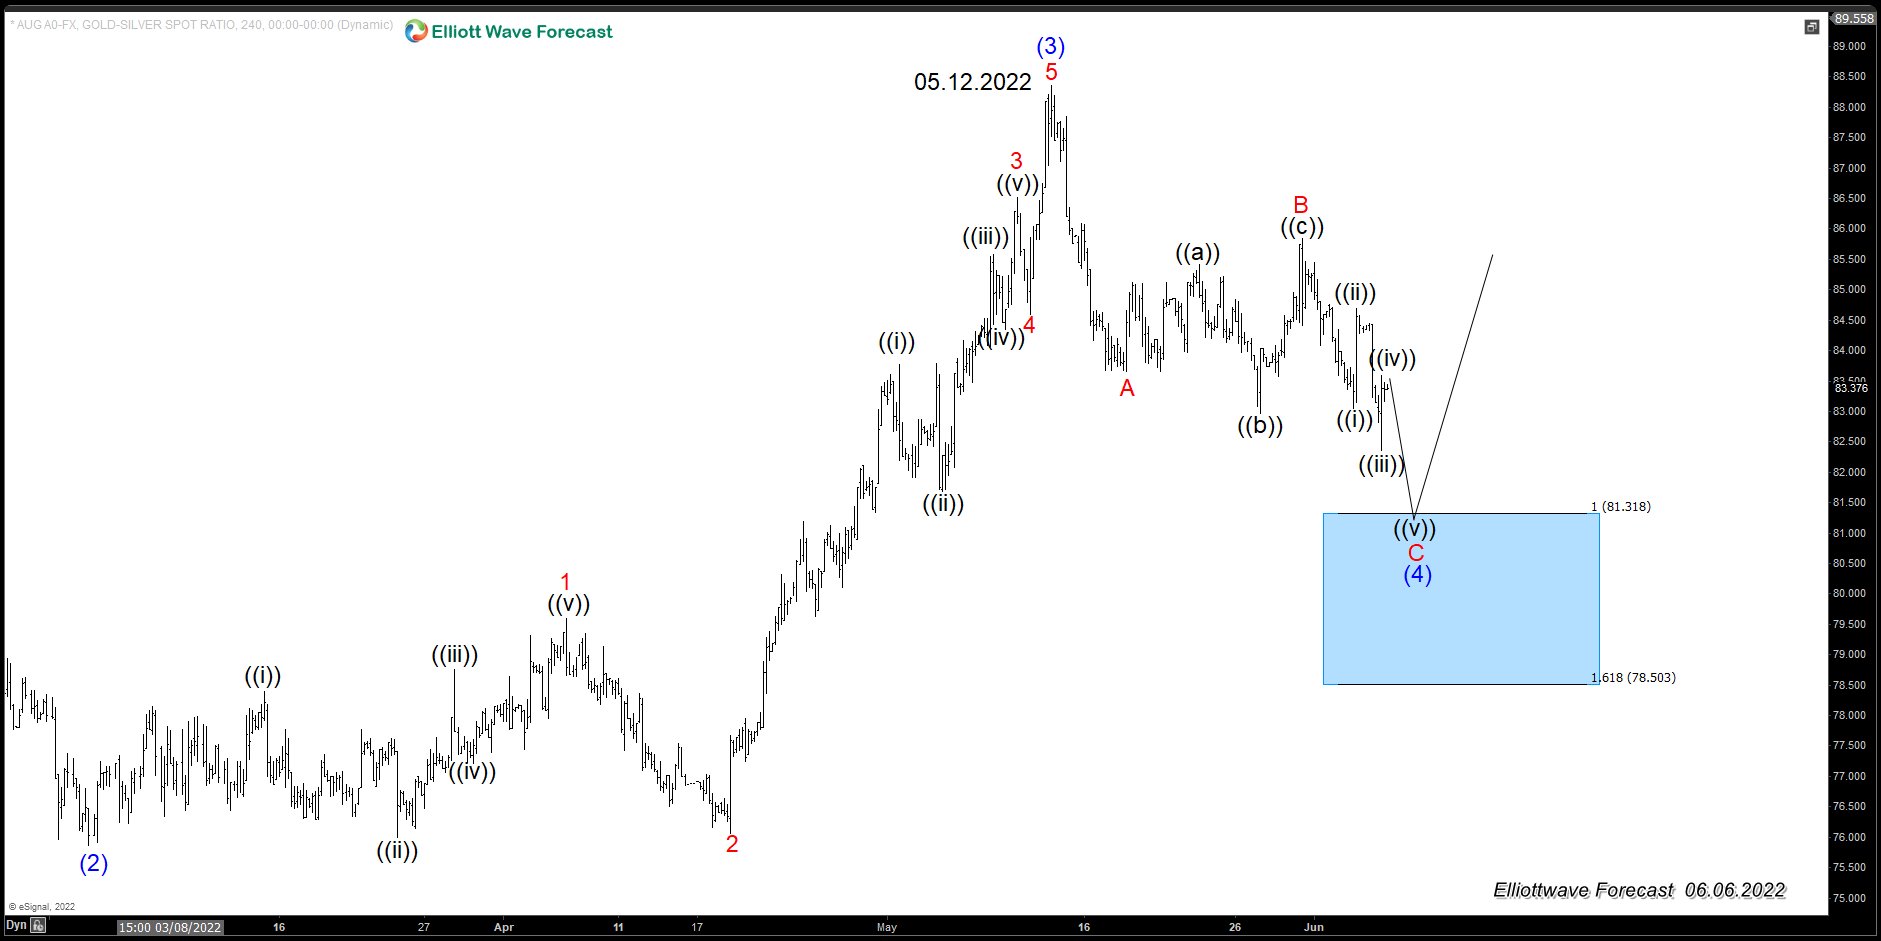
The chart above shows the 4 Hour view of the Ratio and the possible short-term path. The ratio can see $81.31-$78.50 area. The decline of the peak at 05.12.2022 comes in an ABC structure with 5-3-5 subdivision. The 05.12.2022 peak of wave (3) in the Ratio agrees with the lows in Silver as well as the peak in the US Dollar. The new lows in the Ratio should support Silver. We believe the Ratio will extend higher in the second half of the year before the seller enters the market.
Gold-to-Silver and Silver Overlay
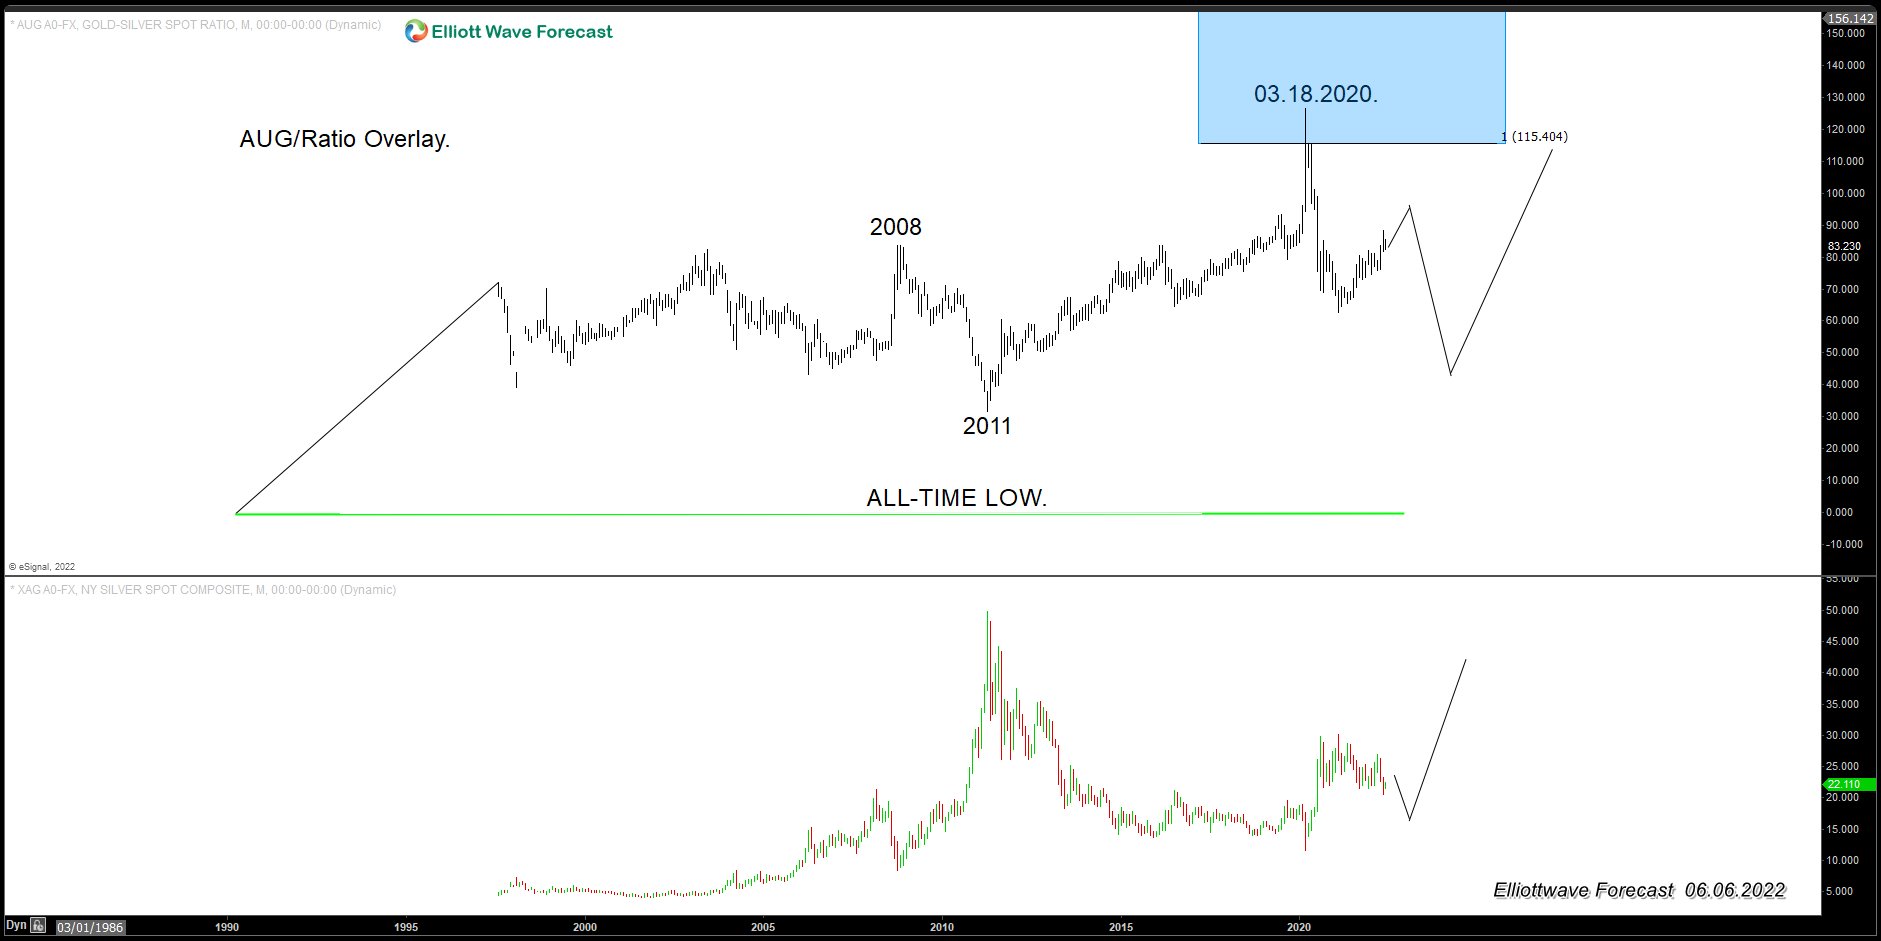
The chart above shows the Gold-to-Silver Ratio and Silver chart overlaid on top of each other. We have concluded that a path higher in the Ratio before turning lower will make Silver going lower first before turning higher. $94.57-$106.00 in the Ratio will create a new cycle higher in Silver and lower $USDX.
In conclusion, the Ratio has the potential to extend higher into the Blue Box area, which will make the Silver trade lower. We should see a cycle similar to one of the peaks at 03.2020 to re-test the lows and make the $USDX trade lower, and Silver higher.