
The Fed has been very clear that their current mission is to reduce U.S inflation rate which is currently running at 8.3%. This is way over thier 2% target inflation rate. Two factors contribute to the high inflation rate: Demand and Supply. The Fed can only affect the demand by increasing the fed funds rate. This will result in the demand destruction, increasing the risk of economic recession. Supply however remains limited due to underinvestment in energy sector, war between Russia-Ukraine, and Covid-19 lockdown in China. Thus it’s likely the Fed can trigger significant economic deceleration with their rate hikes if the supply side doesn’t improve.
Already the market responding negatively to the Fed’s plan. Both stocks and bonds have negative performance Year-to-Date. Crypto currency markets are also in turmoil with the latest collapse of algorithmic stablecoin TerraUSD (Luna). Below is Year to Date performance of various markets:
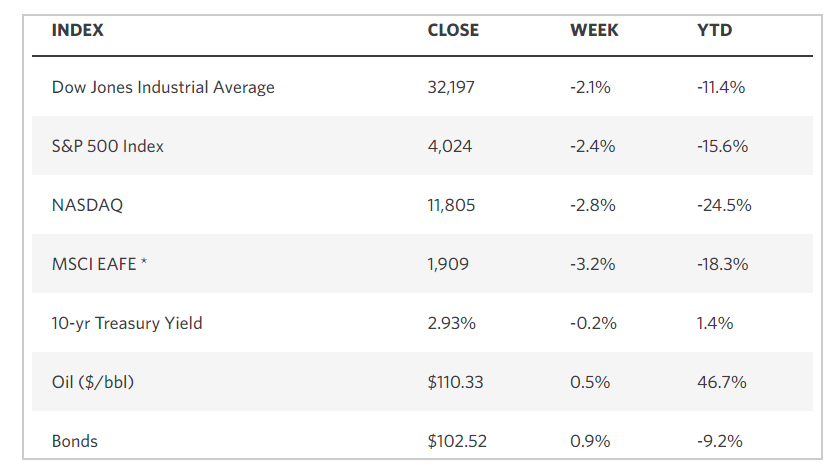
With the exception of energy and US Dollar, practically all markets are negative Year-to-Date. In this article, we will take a look at one energy stock Occidental Petroleum (ticker: OXY). Oxy is an American company engaged in oil and gas operations in three areas: the United States, the Middle East, and Columbia. Warren Buffet’s Berkshire Hathaway has continued to buy the shares increasing its stake to 15.3% recently.
OXY Monthly Elliott Wave Chart
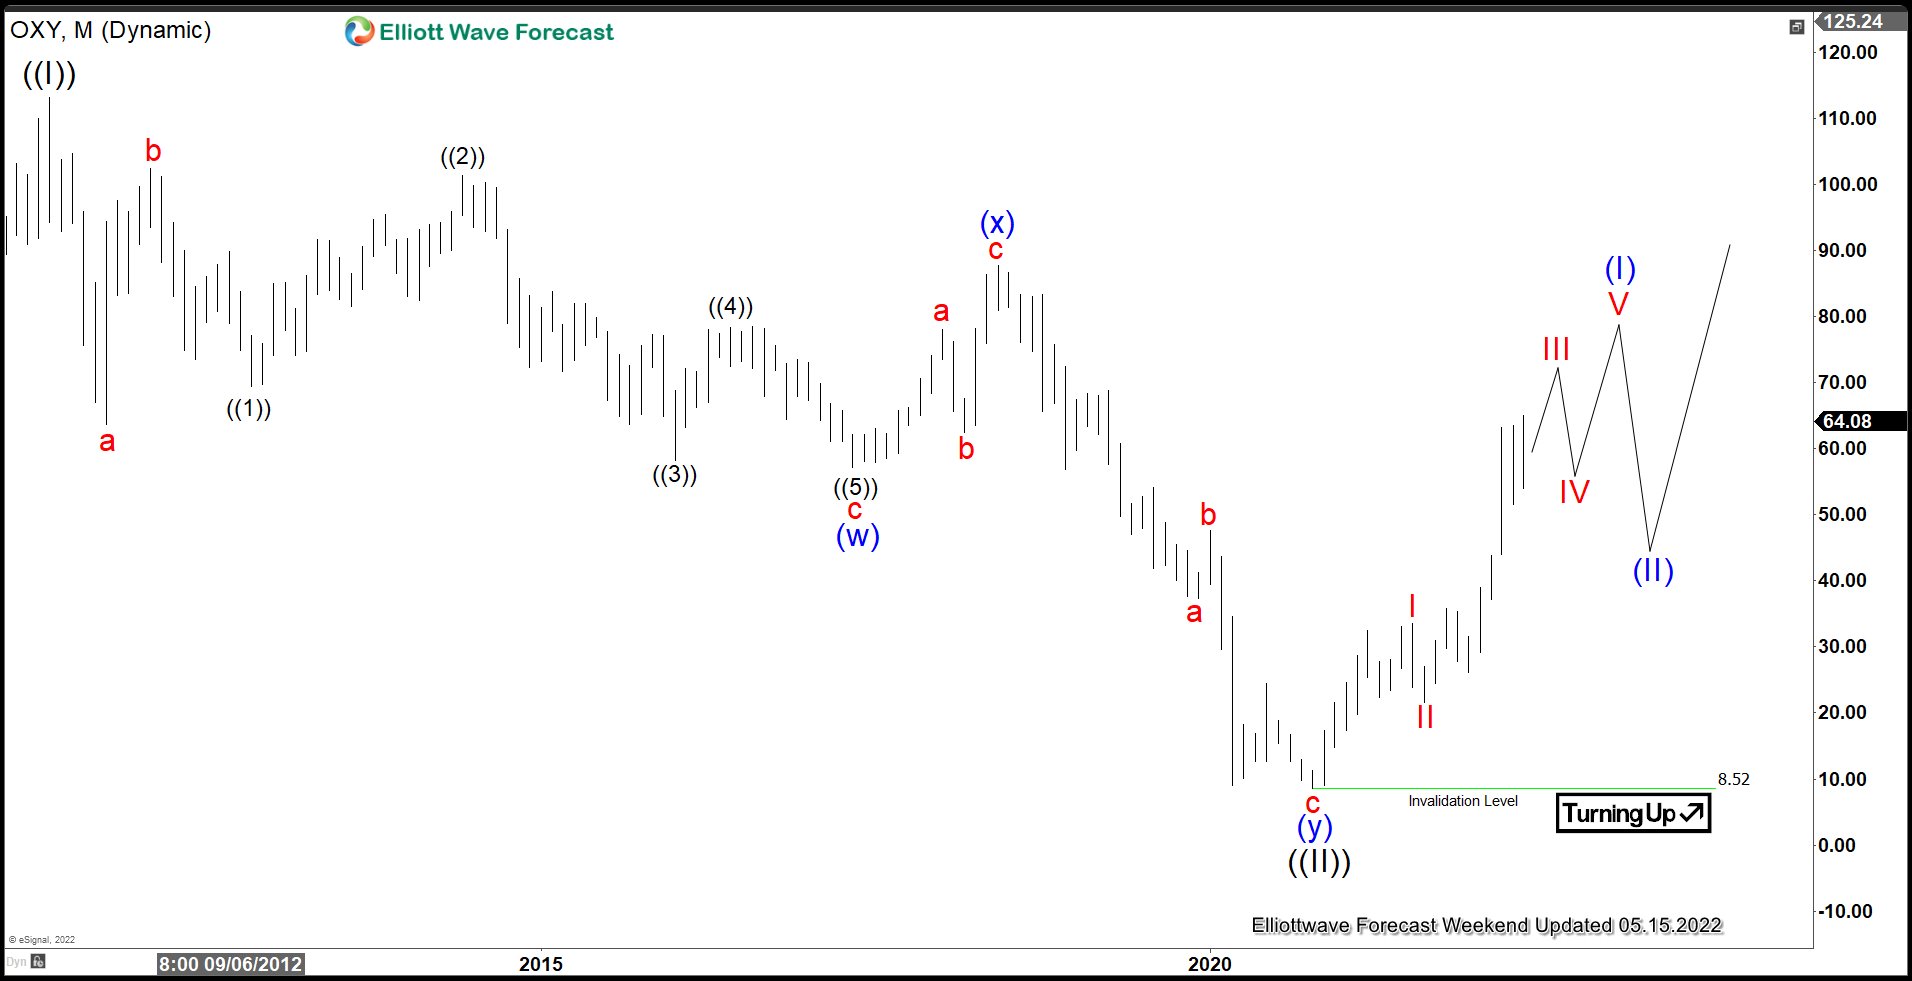
Monthly chart of OXY above shows that the rally to 113.08 on May 2011 ended wave ((I)), and wave ((II)) pullback has ended at 8.52. Up from there, the stock has turned higher in wave ((III)). The rally from wave ((II)) low on October 2020 is unfolding as a 5 waves impulse Elliott Wave structure. Up from Wave ((II)), wave I ended at 33.50 and wave II ended at 21.62. Expect the stock to continue higher a few more times before finishing wave V. This should then also complete wave (I) before a larger pullback in wave (II) and higher again. As far as pivot at 8.52 low stays intact, expect dips to find support in 3, 7, 11 swing for further upside.
OXY Daily Elliott Wave Chart
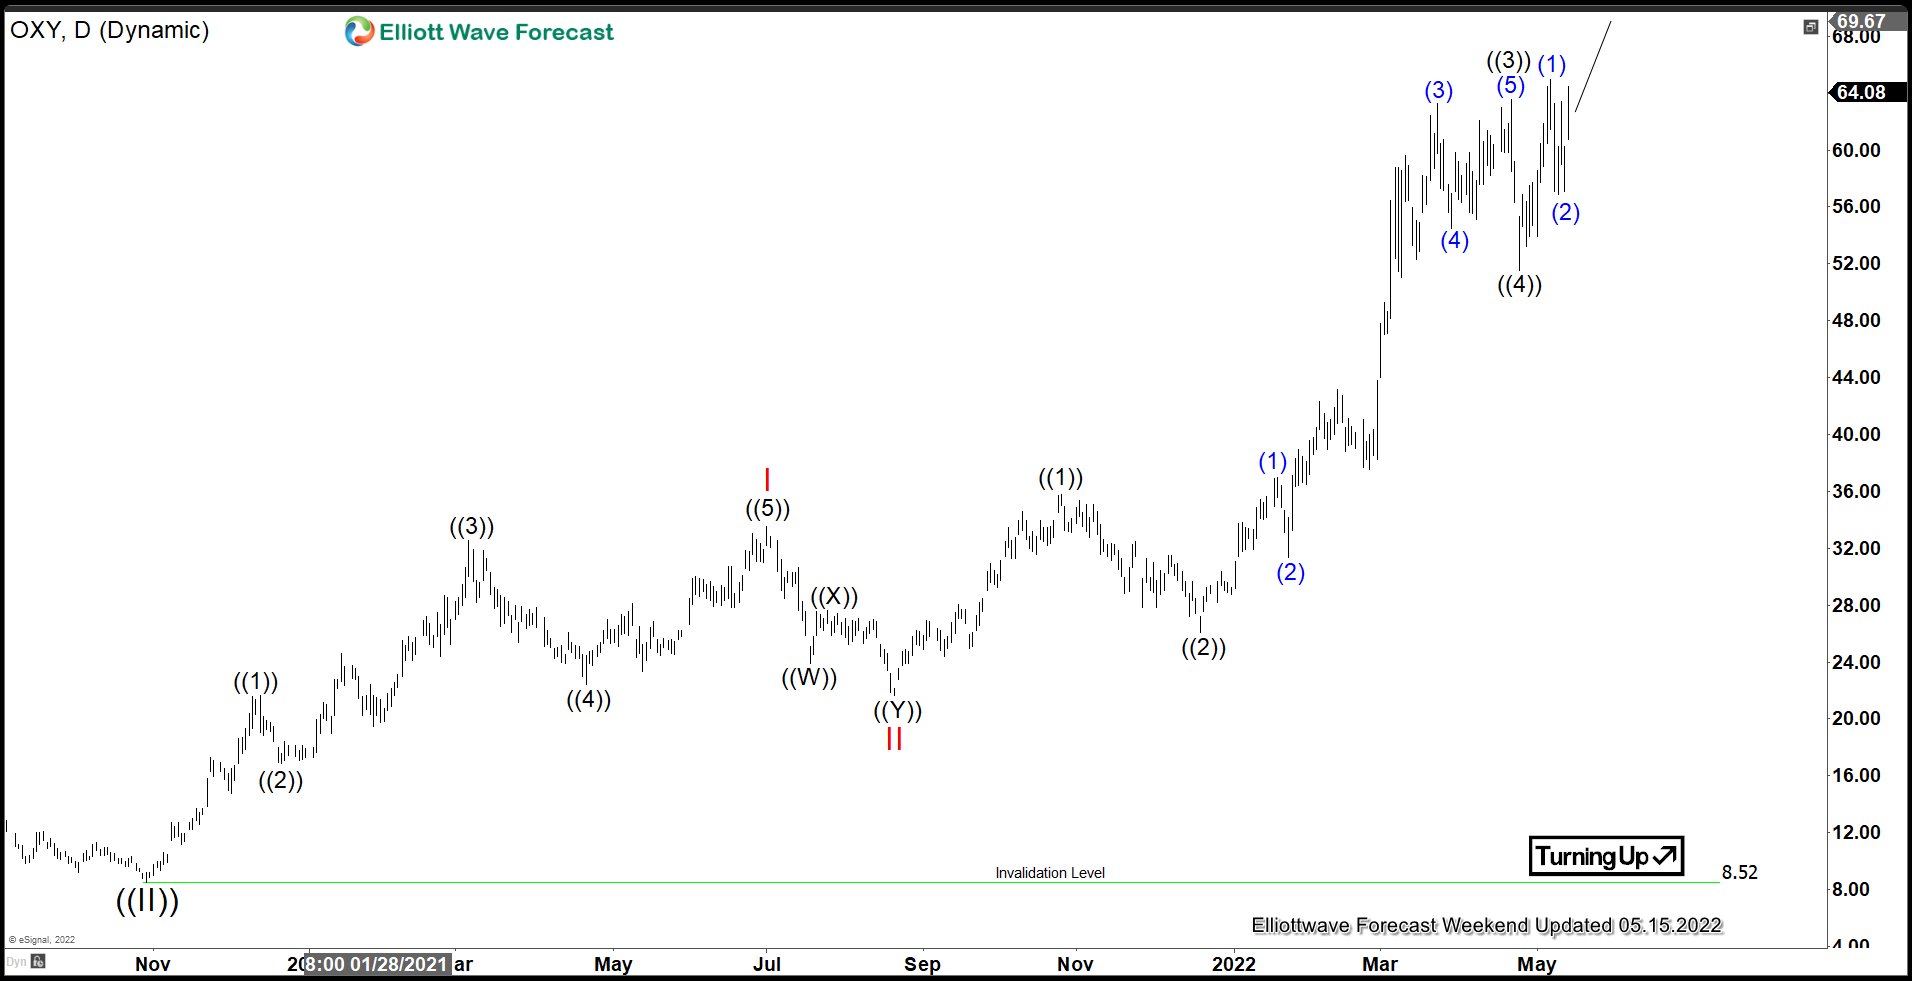
Daily Elliott Wave chart of OXY above shows the stock continues to rally from wave ((II)) low as a 5 waves impulse structure. Up from wave ((II)), wave I ended at 33.5 and wave II ended at 21.62. Wave III remains in progress with internal as a 5 waves in lesser degree. Up from wave II, wave ((1)) ended at 35.75 and pullback in wave ((2)) ended at 26.05. Wave ((3)) ended at 63.56 and wave ((4)) ended at 51.53. While above 51.53, and more importantly above 8.52, expect dips to find support in 3, 7, 11 swing for further upside.
Source: https://elliottwave-forecast.com/stock-market/energy-stock-continues-outperform-oxy-bullish-outlook/