
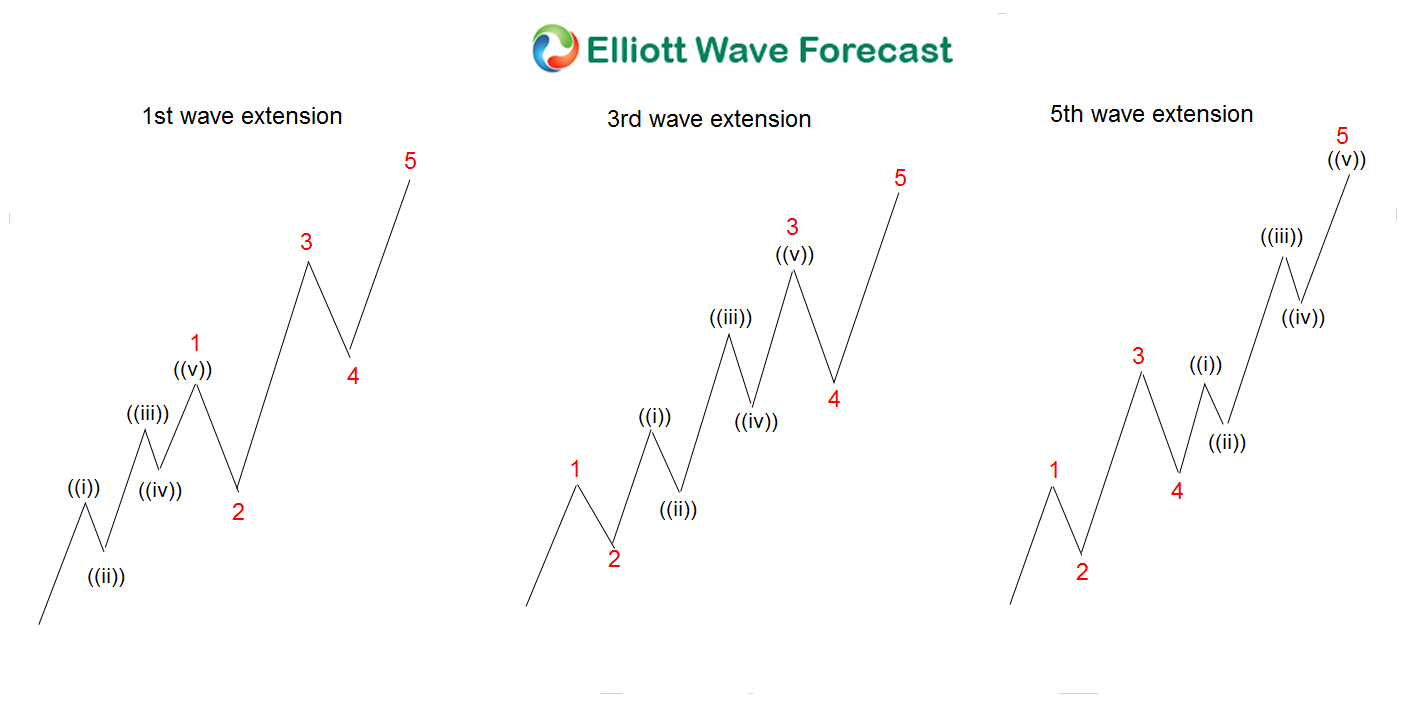
Back in 2020, during the big pullback in Delta (DAL), we were able to tell members and followers to buy the pullback. We suspect that a nest is taking place A nest is a series of 1 and 2 with extension within the extended portion of an impulse structure. Below is a graph showing how the various nests look like in the Elliott Wave Theory. As we can see there is a series of 1-2 with an extension or strong advance into the upside.
Delta Monthly Elliott Wave Chart
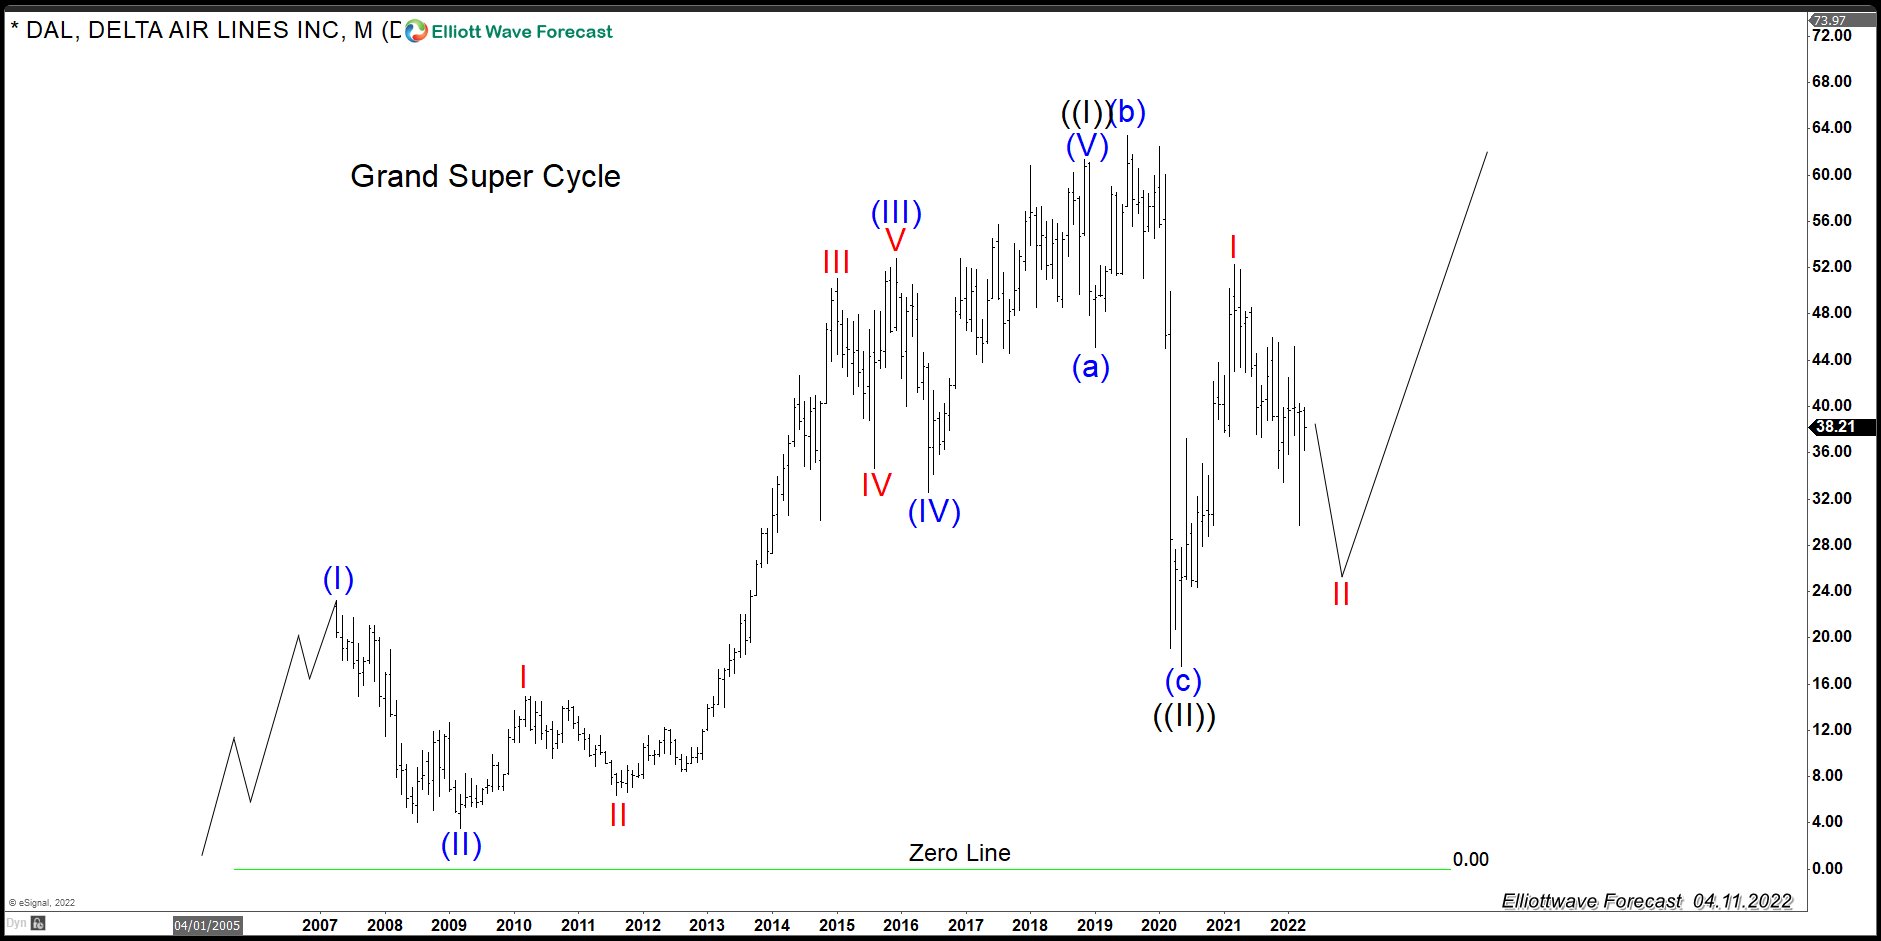
In the chart above, Delta formed a secondary low in 2009 then it broke higher in 2011. The Grand Super Cycle made a five waves advance and then pullback in three waves, ending in 2020. As we can see, the trend is higher. Since the market does not move in a straight line, there will always be corrections. we label the correction in the Elliott Wave Theory as ABC, WXY, or FLAT. The wave ((II)) pullback in Delta took the form a FLAT, which is labeled as (a),(b),(c) in Blue.
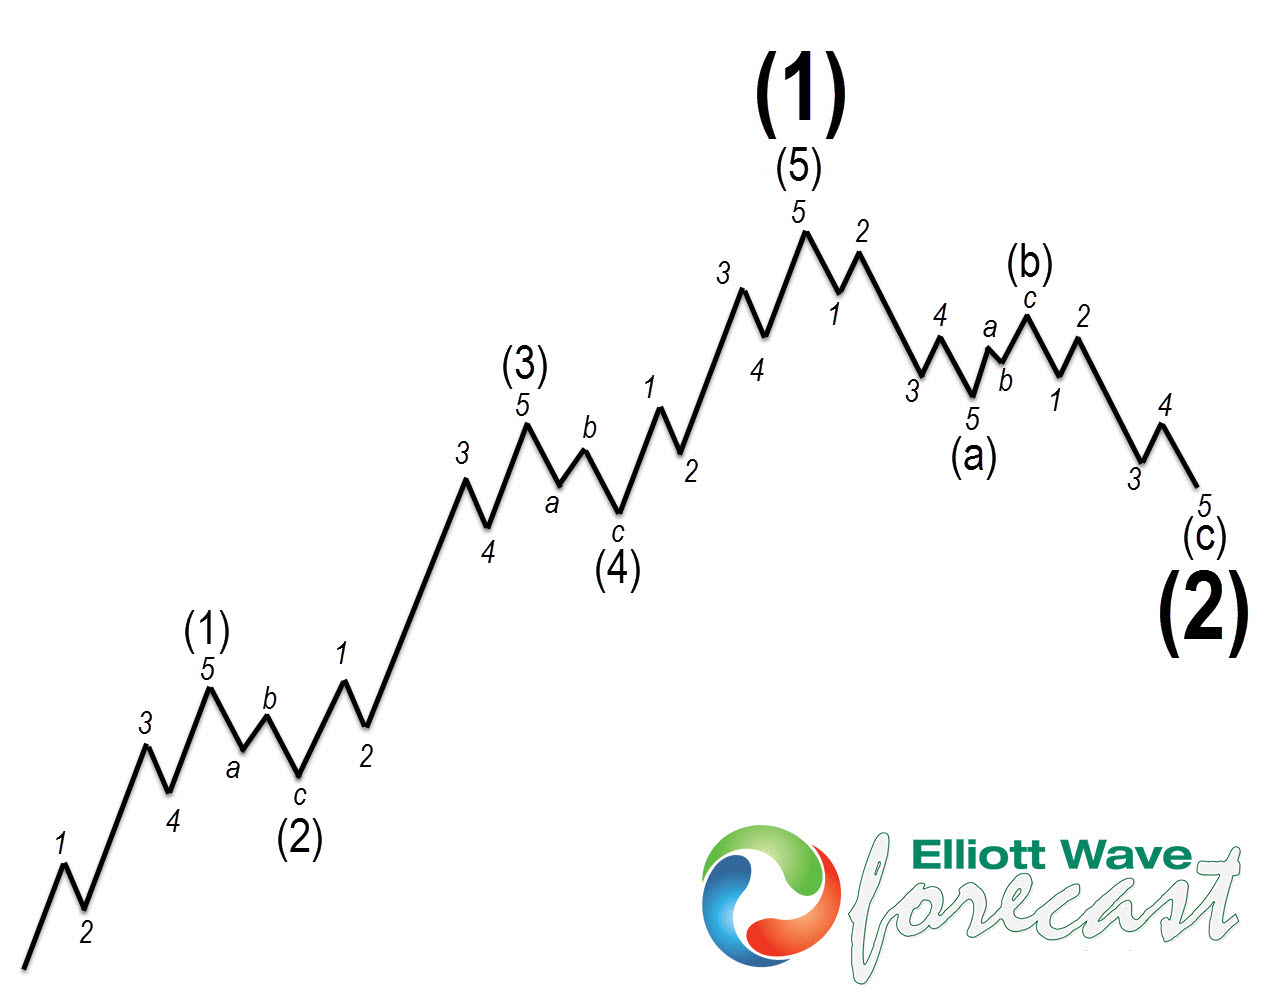
The following chart shows how the five waves advance looks like in the Elliott Wave Theory and the expected three waves pullback.
Delta Daily Elliott Wave Chart
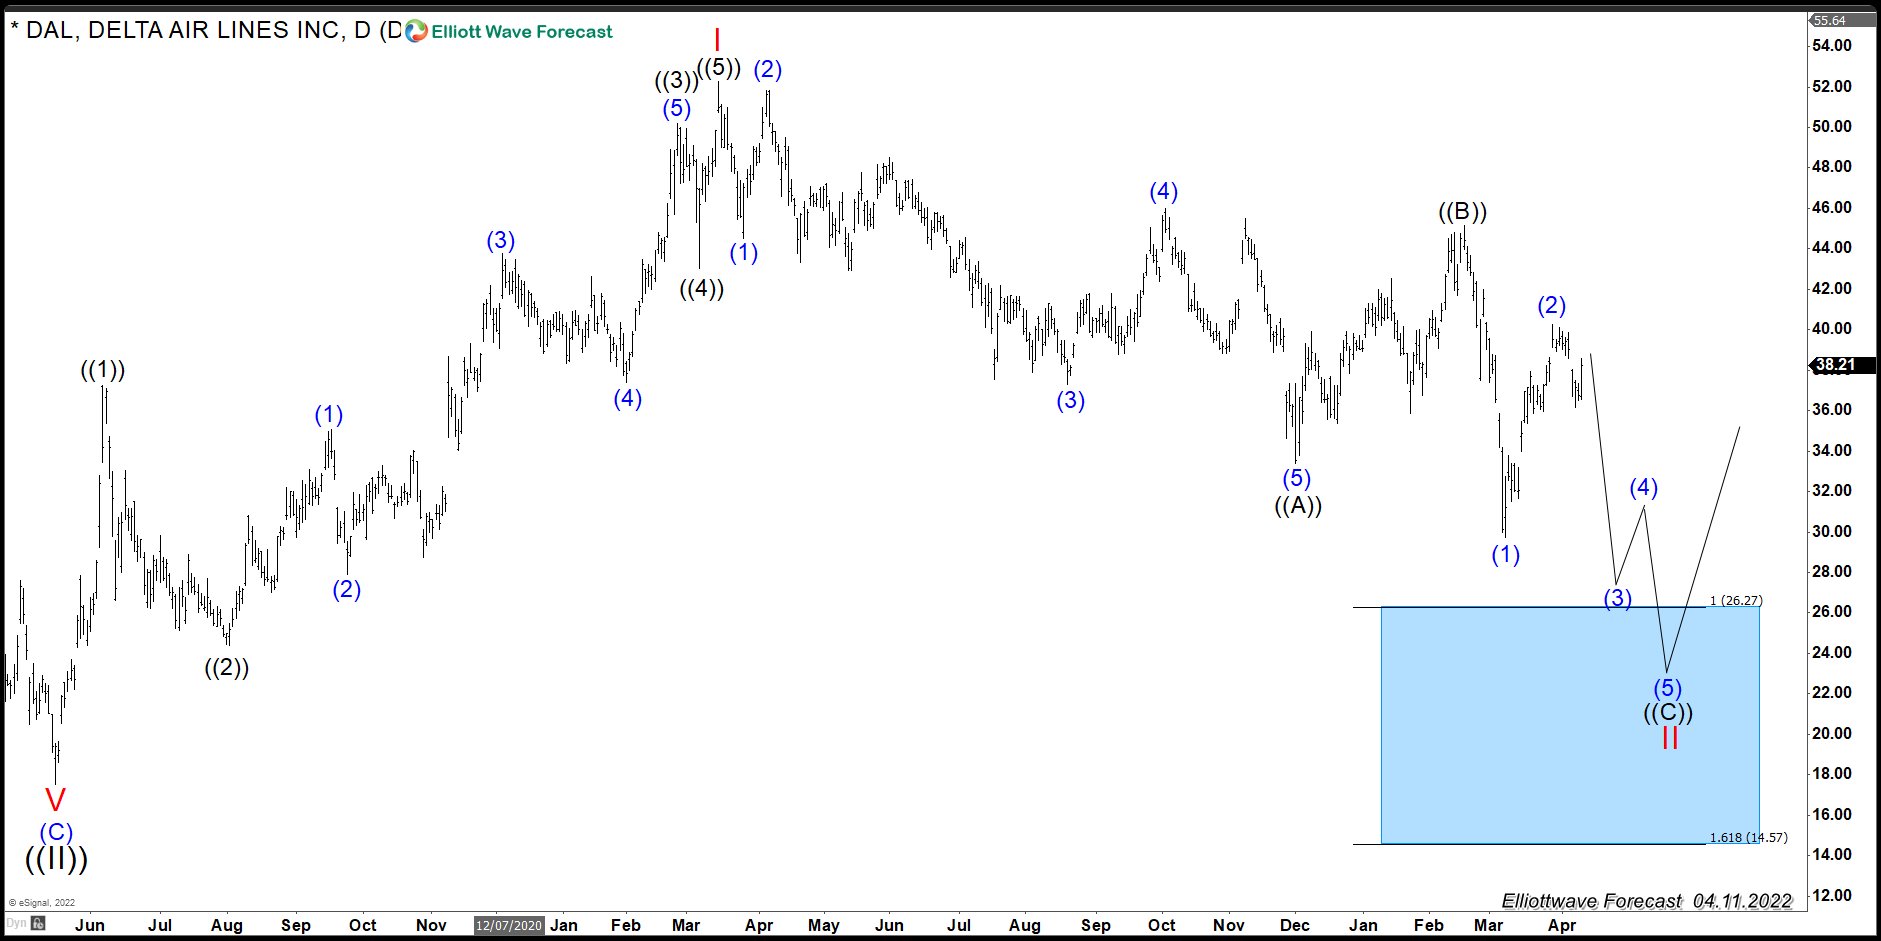
In the daily chart above, we present the ideal area to buy Delta in the blue box. We can see the reaction since the lows in 2020 which comes with a very nice five waves advance. Currently, the stock is in the process of an ((A)),((B)), ((C)) zigzag correction. Delta already has a clear three waves pullback, thus wave II can technically be complete. However, an extension lower within the ((C)) leg can’t be ruled out. We do not recommend shorting the stock. Rather, we recommend buying into the next dip. As we always said, the path to being profitable is trading within the higher time frame such as daily. It provides traders with positions they can hold for years.