
The $CAC40 Index Bullish Cycles & Longer Term Swings
Firstly the CAC 40 index has been trending higher with other world indices where in September 2000 it put in an all time high at that point. From there it followed the rest of the world indices lower into the March 2003 lows which was a larger degree pullback. From there the index rallied with other world indices again until June 2007. It then corrected that rally again as did most other world stock indices. It ended this larger degree correction in March 2009. From those 2009 lows, the index shows an incomplete bullish swing sequence that favors further upside.
Secondly, in February 2020 the uptrend cycle from the March 2009 lows ended with the pullback into the March 2020 lows. From there the next longer term target area highlighted on the chart was reached in January 2022. The analysis continues below the chart.
$CAC40 Index Monthly Chart
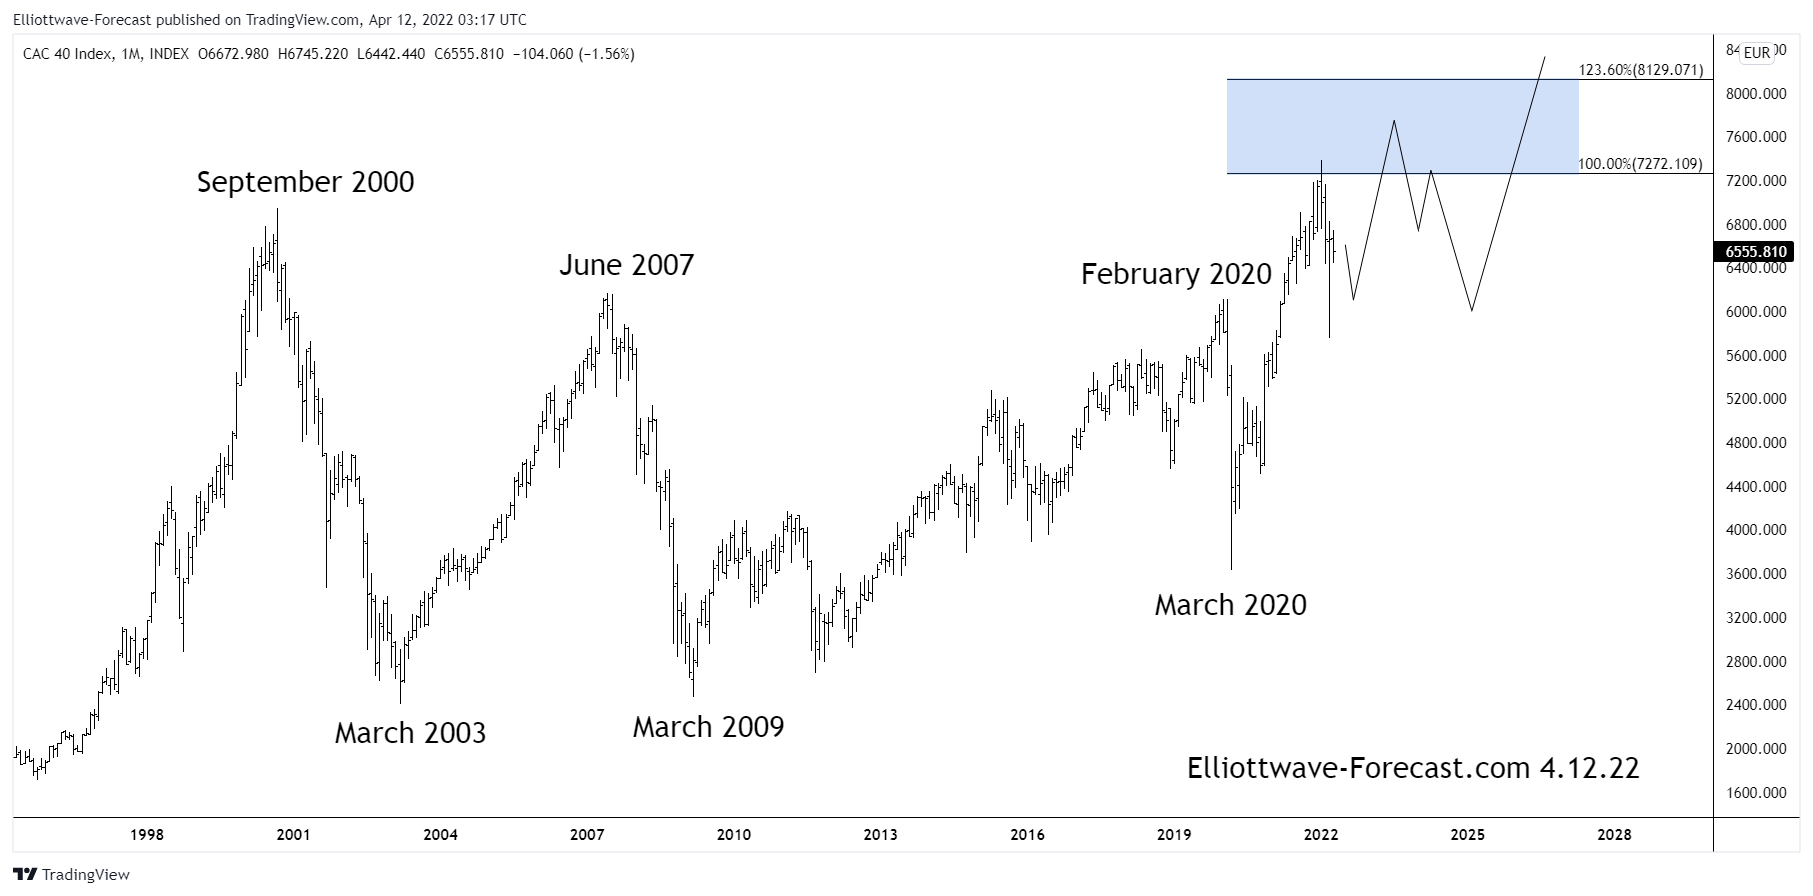
The target extension areas are measured as per the following. Use a Fibonacci extension tool on a charting platform. On this chart, point 1 will be at the beginning of the cycle at the March 2009 lows. From there on up to the February 2020 highs will be point 2. The point 3 will be down at the March 2020 lows. The extension areas shown are the same as long as price remains above those March 2020 lows. As of now, the index appears to have an Elliott Wave impulse higher in progress that appears to be in a wave three. If so ideally pullbacks should remain above the March 2022 lows while continuing the trend higher.
Lastly in conclusion the index is now showing a new all time high in January 2022. While above the March 2022 lows & more importantly the March 2020 lows the index should continue higher during this period of multiple world indices bullish trends higher.
Source: https://elliottwave-forecast.com/stock-market/the-cac40-index-bullish-cycles-longer-term-swings/