
Hello Fellow Traders. In this technical blog we’re going to take a look at the Elliott Wave charts charts of EURUSD forex pair published in members area of the website. The pair is trading within the cycle from the January 2021 peak which is having the form of impulsive structure. Recently the pair corrected the short term cycle from the September 2021 peak. Recovery unfolded as Elliott Wave Irregular Flat structure. Once target area was reached, EURUSD found sellers as expected and we got turn lower. In further text we’re going to explain the forecast and Elliott Wave Pattern.
Before we take a look at the real market example of Expanded Flat, let’s explain the pattern in a few words.
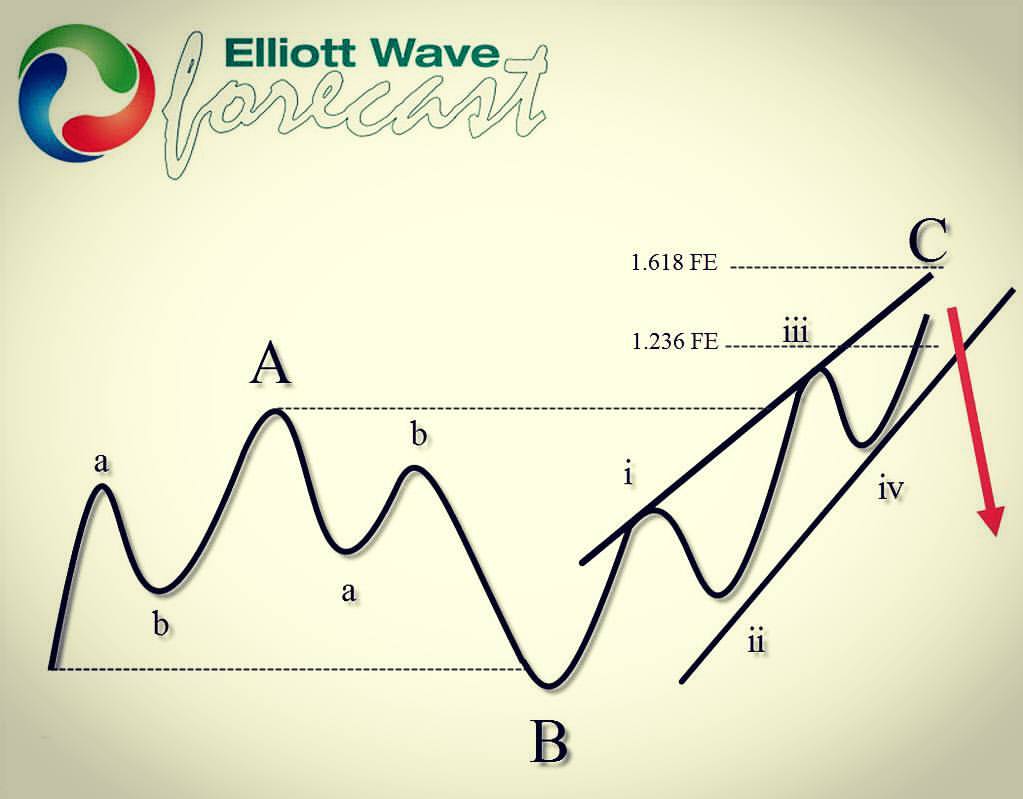
Elliott Wave Expanded Flat Theory
Elliott Wave Flat is a 3 wave corrective pattern which could often be seen in the market nowadays. Inner subdivision is labeled as A,B,C , with inner 3,3,5 structure. Waves A and B have forms of corrective structures like zigzag, flat, double three or triple three. Third wave C is always 5 waves structure, either motive impulse or ending diagonal pattern. It’s important to notice that in Irregular Flat Pattern wave B completes below the starting point of wave A. Wave C ends above the ending point of wave A . Wave C of Flat completes usually between 1.00 to 1.236 Fibonacci extension of A related to B, but sometimes it could go up to 1.618 fibs ext.
At the graphic below, we can see what Expanded Flat structure looks like
Now, let’s take a look what Elliott Wave Flat Pattern looks like in the real market
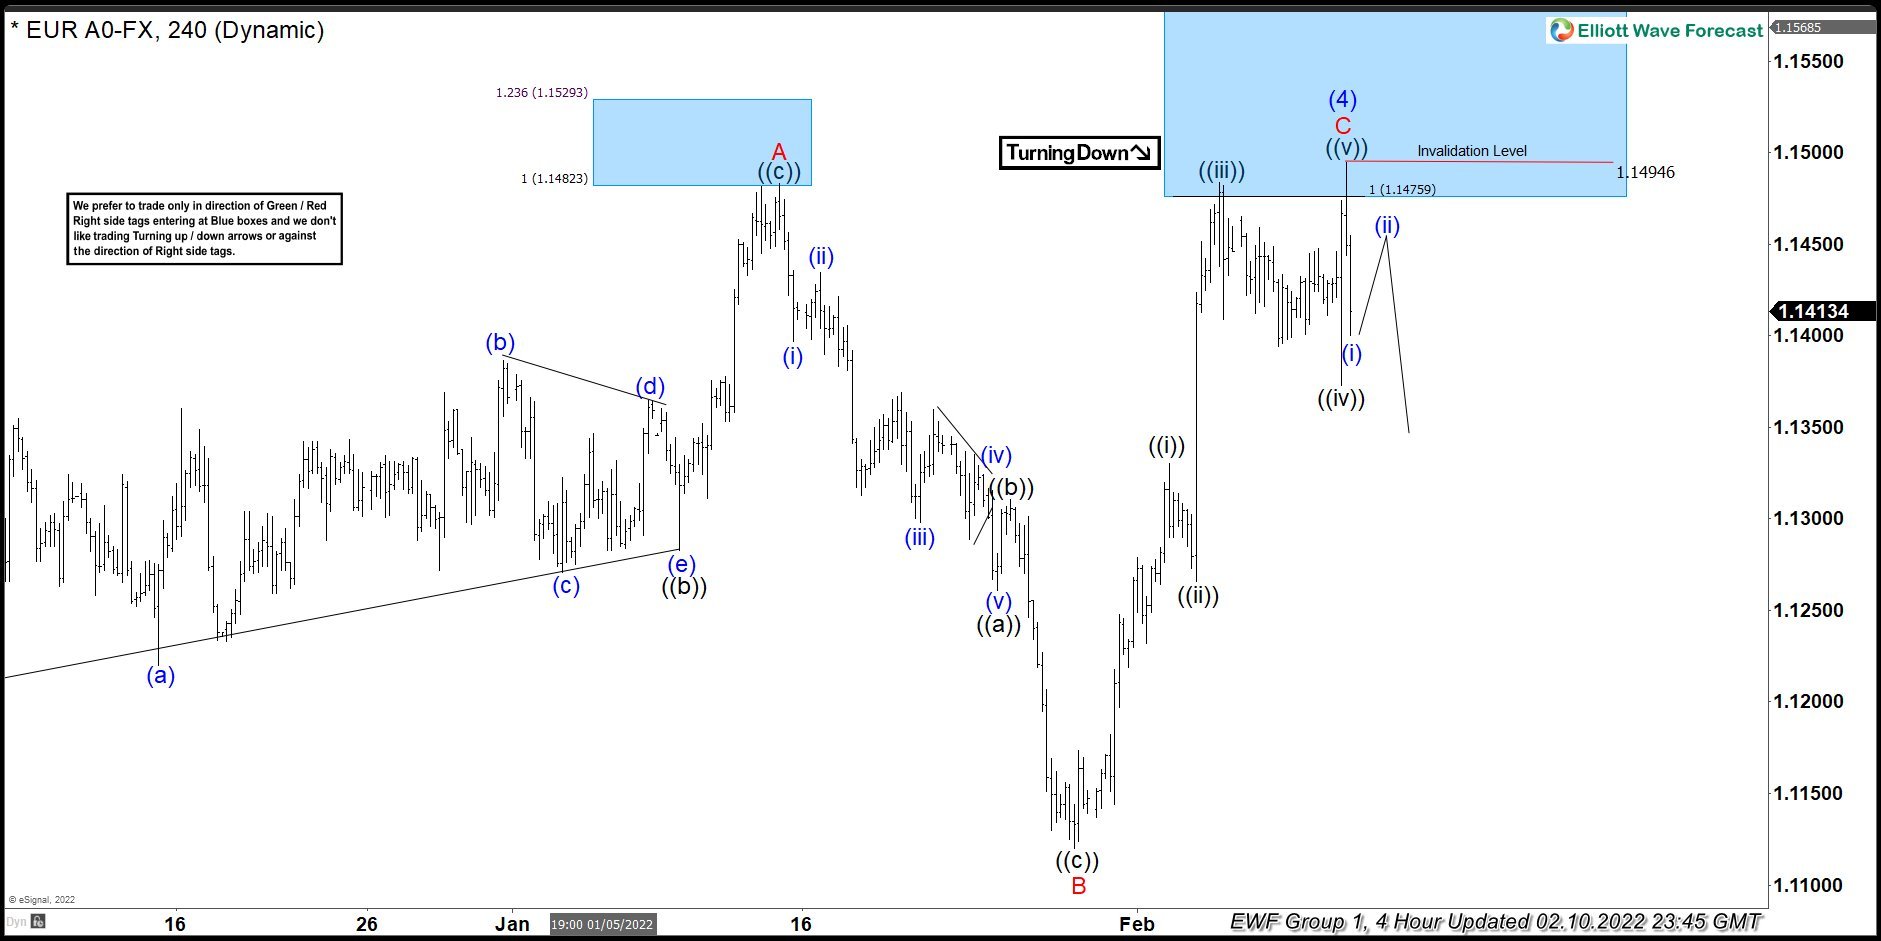
EURUSD 4h Hour Elliott Wave Analysis 2.10.2022.
EURUSD has given us recovery against the September 2021 peak. Waves A and B red are showing corrective sequences. Wave B red has broken the starting point of A red, which makes this Flat Irregular. At this stage we can see that the price has reached equal legs area A-B at 1.14759 which is minimum requirement for a correction to complete. We can already count clear 5 waves up from the recent low: 01.28.- B red, which is the last leg C red of proposed (4) blue recovery. Wave (4) correction looks to be completed at 1.14946 high as Elliott Wave Flat Pattern. We would like to see further separation lower against that peak. As our members know, flat patterns can be tricky to trade. We rather avoid forcing trades when corrections are having forms of Flats.
You can learn more about Elliott Wave FLAT and other Patterns at our Free Elliott Wave Educational Web Page
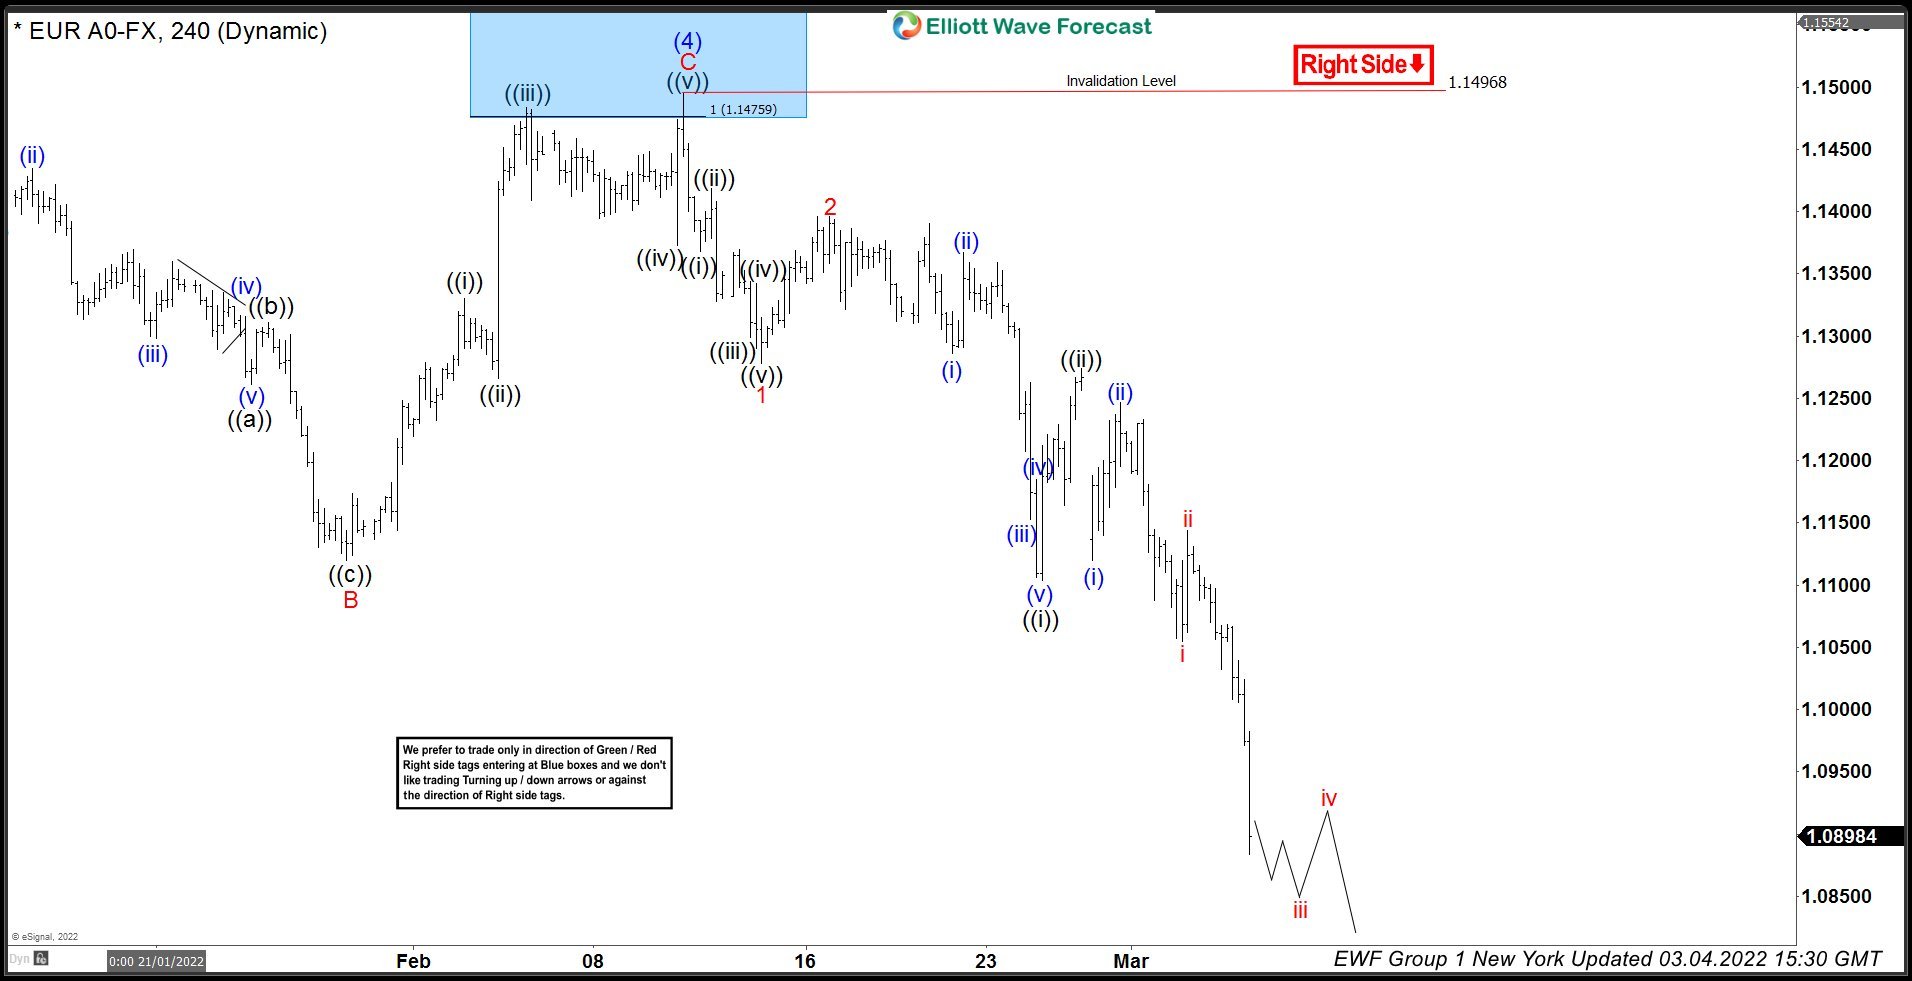
EURUSD 4h Hour Elliott Wave Analysis 2.10.2022.
1.14946 high held nicely during the short term bounces. The pair made further decline as we expected. Eventually EURUSD broke the previous low: January 28th, which made bearish sequences again in the pair. EURUSD is now bearish against the 1.14968 pivot, and remains sell in short term rallies in 3,7,11 swings.
Keep in mind that market is dynamic and presented view could have changed in the mean time. You can check most recent charts in the membership area of the site. Best instruments to trade are those having incomplete bullish or bearish swings sequences. We put them in Sequence Report and best among them are shown in the Live Trading Room.
Elliott Wave Forecast
Source: https://elliottwave-forecast.com/forex/eurusd-elliott-wave-calling-decline-flat/