RTSI is a Russian stock market index representing 50 most important companies on the Moscow Stock Exchange. From the introduction in 1995 until May 2008, RTS index has performed very well. Then, the index remains sideways while American indices are rallying. One of the reasons for this lagging behavior could be the highly depressed commodity prices. As a matter of fact, Russian companies are strongly represented in the oil, gas, refining, metals and mining industries. Hence, it is obvious that in a period of strong US dollar and low commodity prices, those companies could not rise significantly. Currently, commodity prices seem to turn higher which can give a fuel for RTSI for a long expected rally.
RTSI Weekly Elliott Wave Analysis 02.21.2022
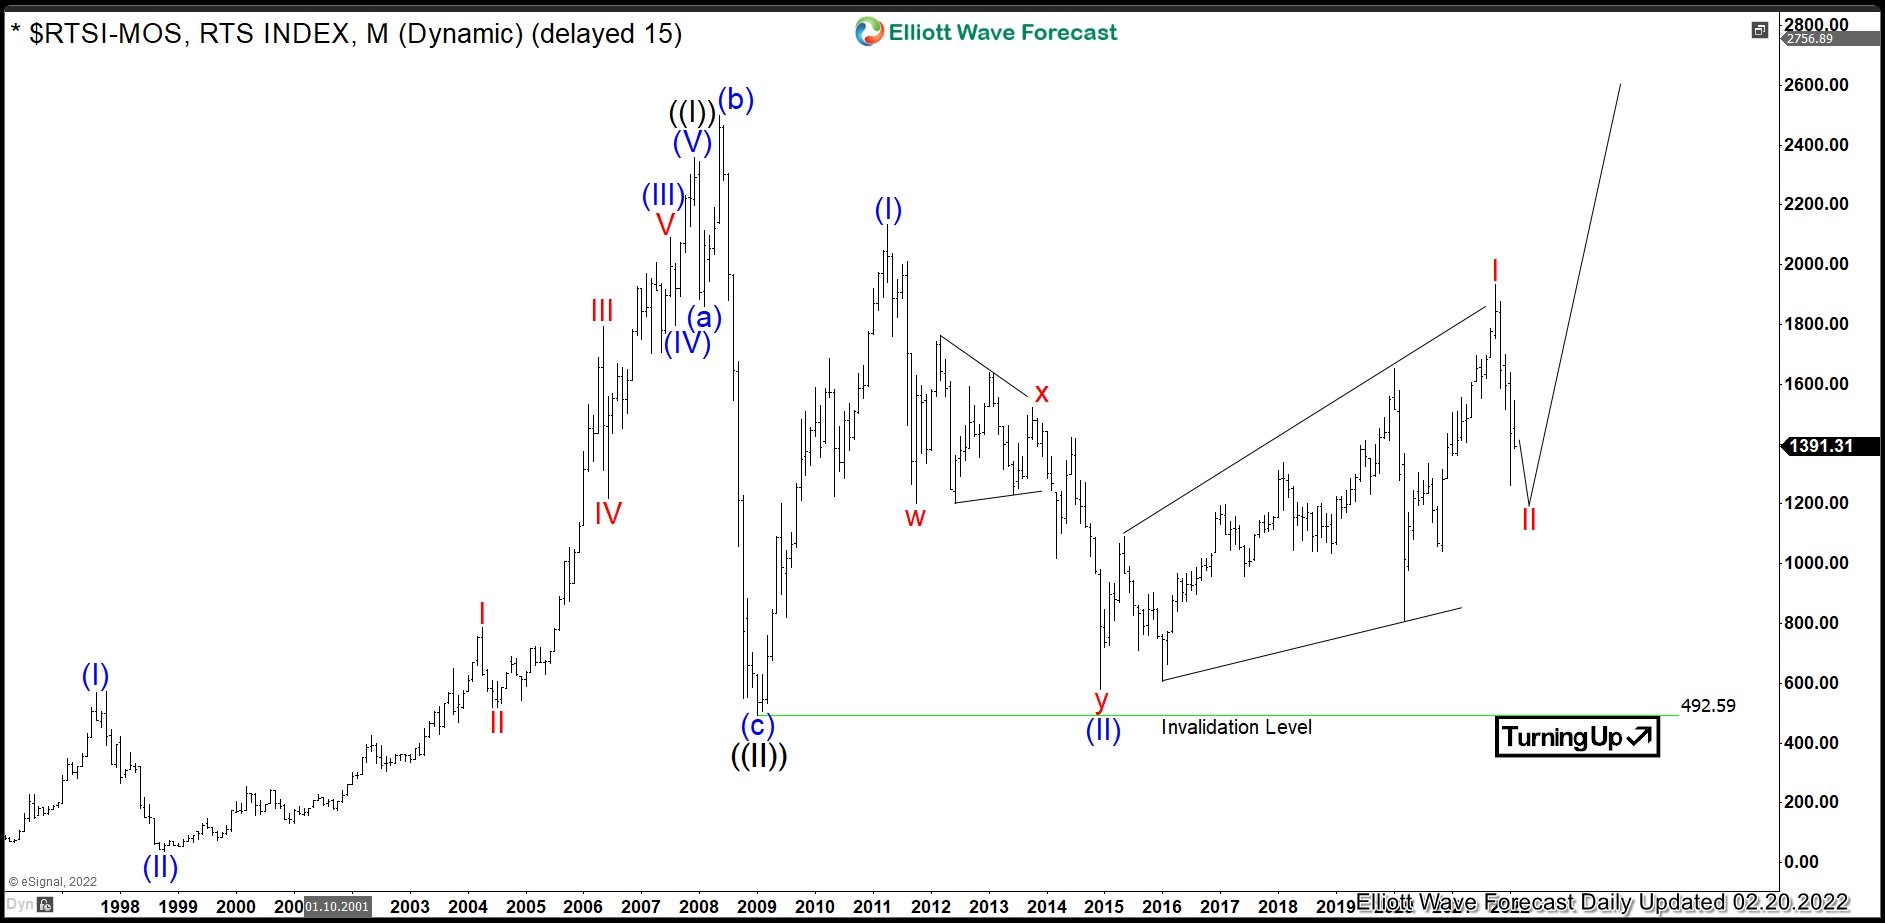
The weekly chart below shows the RTS Index on the Moscow Stock Exchange. First, the stock price has developed a cycle higher in wave ((I)). The impulse has printed the top on December 2007 at 2345.45. Then, the correction lower in wave ((II)) has unfolded as an expanded flat. Hereby, wave (b) of ((II)) has set the all-time high in May 2008 at 2498.10. From there, wave (c) has reset lower and printed an important bottom on January 2009 at 492.59.
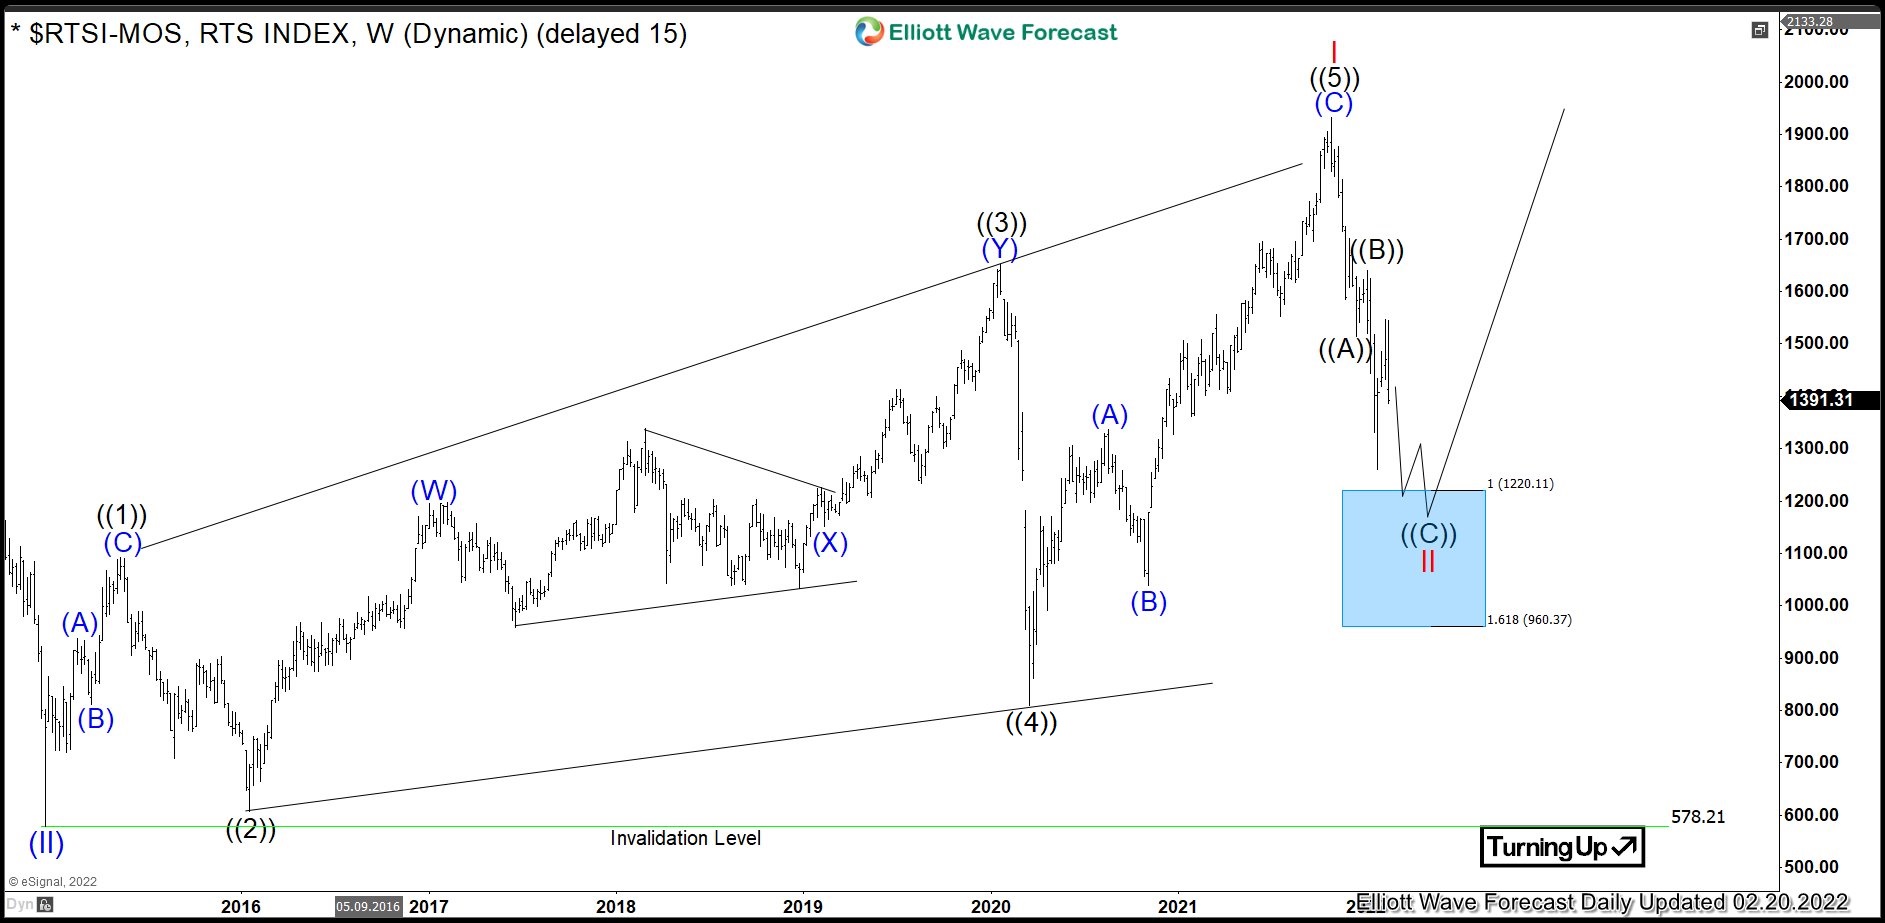
While RTSI is trading above 492.59, wave ((III)) is in progress. One can see, hereby, 2 nests which represent series of waves 1 and 2. Indeed, first nest being waves (I)-(II) has ended on December 2014 at 578.21. The 2nd nest containing waves I and II is still in progress. Once accomplished, expect acceleration higher in wave III of (III) of ((III)).
The target for black wave ((III)) is 2851.30-4310.89 area and even beyond.
RTSI Weekly Elliott Wave Analysis 02.21.2022
The daily chart below shows in more detail the leading diagonal in wave in wave I and decline lower in wave II. The consolidation in wave II is an Elliott Wave zigzag structure. While below 1640.39, wave ((C)) should reach in 5 waves lower. Investors and traders should be looking to buy RTSI from 1220.11-960.37 area. There, a rally in wave III of (III) should take place or a bounce in 3 waves as minimum. The target for blue wave (III) is 2224.10-3241.58 area.
If commodities are going to rally, then RTSI might outperform US american indices providing a good investment possibility for long and medium term. As an outlook, TSX may rally to the monthly equal legs towards 2851.30-4310.89 area.
Source: https://elliottwave-forecast.com/stock-market/russian-index-rtsi-huge-rally/