
Back in December 2020, we presented within the main article both the monthly and the daily view in the USDRUB. Long-term, the pair should provide a resolution thrust higher out of a multi-year triangle pattern. This means a weakness of Russian currency. Medium-term, however, we saw Russian Rouble gaining strength as related to the US Dollar. Short-term, Rouble weakness has provided a connector wave higher within USDRUB which might be ending soon. Here, we present the updated monthly and daily charts discussing the medium-term targets.
Rouble Monthly Elliott Wave Analysis 11.28.2021
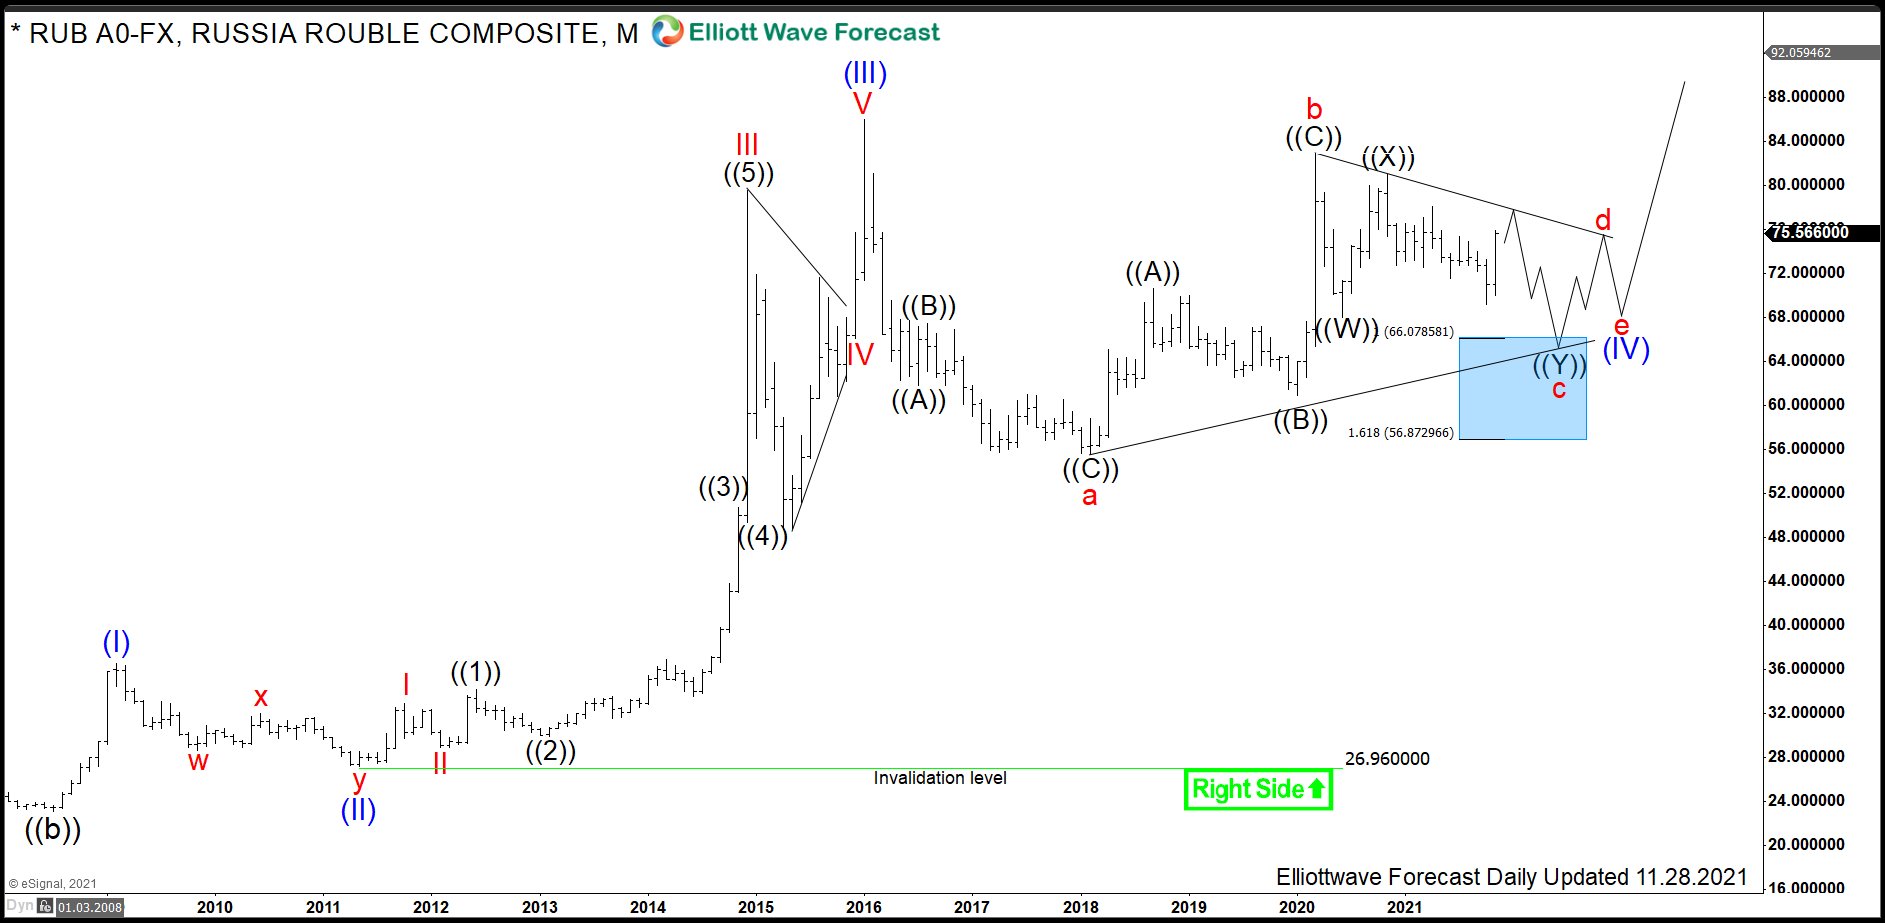
The monthly chart below shows the USDRUB pair traded on the Forex market. From July 2008, the USDRUB is extending higher within a wave ((c)) of a grand super cycle degree. From the 2008 lows at 23.06, the cycle higher has accomplished so far the waves (I)-(III). Hereby, the pair saw the all-time highs on January 2016 at 85.94. Wave (III) has extended far beyond the 1.618 multiples of the wave (I) confirming that the larger cycle from 2008 lows is an impulse. To be mentionned, impulses are motive waves and they count from (I) to (V). Therefore, after a consolidation in wave (IV), at least another push towards 85.94 and higher in wave (V) should be expected. Long term view of USDRUB, as a consequece, favors more Rouble weakness.
In the medium term, Rouble should strengthen against USD. Correlation across the market instruments supports the Elliott Wave contracting triangle pattern in the USDRUB. Triangle is a 3-3-3-3-3 continuation structure. From the January 2016 highs, red waves a and b of the cycle degree have ended on March 2020. While below the 82.90 highs, wave c of (IV) should extend lower towards 66.07-56.87 area. Later on, expect wave d higher to fail below 82.90 highs for another leg lower in wave e. Then, wave (V) can start towards 85.94 highs and even beyond.
Rouble Daily Elliott Wave Analysis 11.28.2021
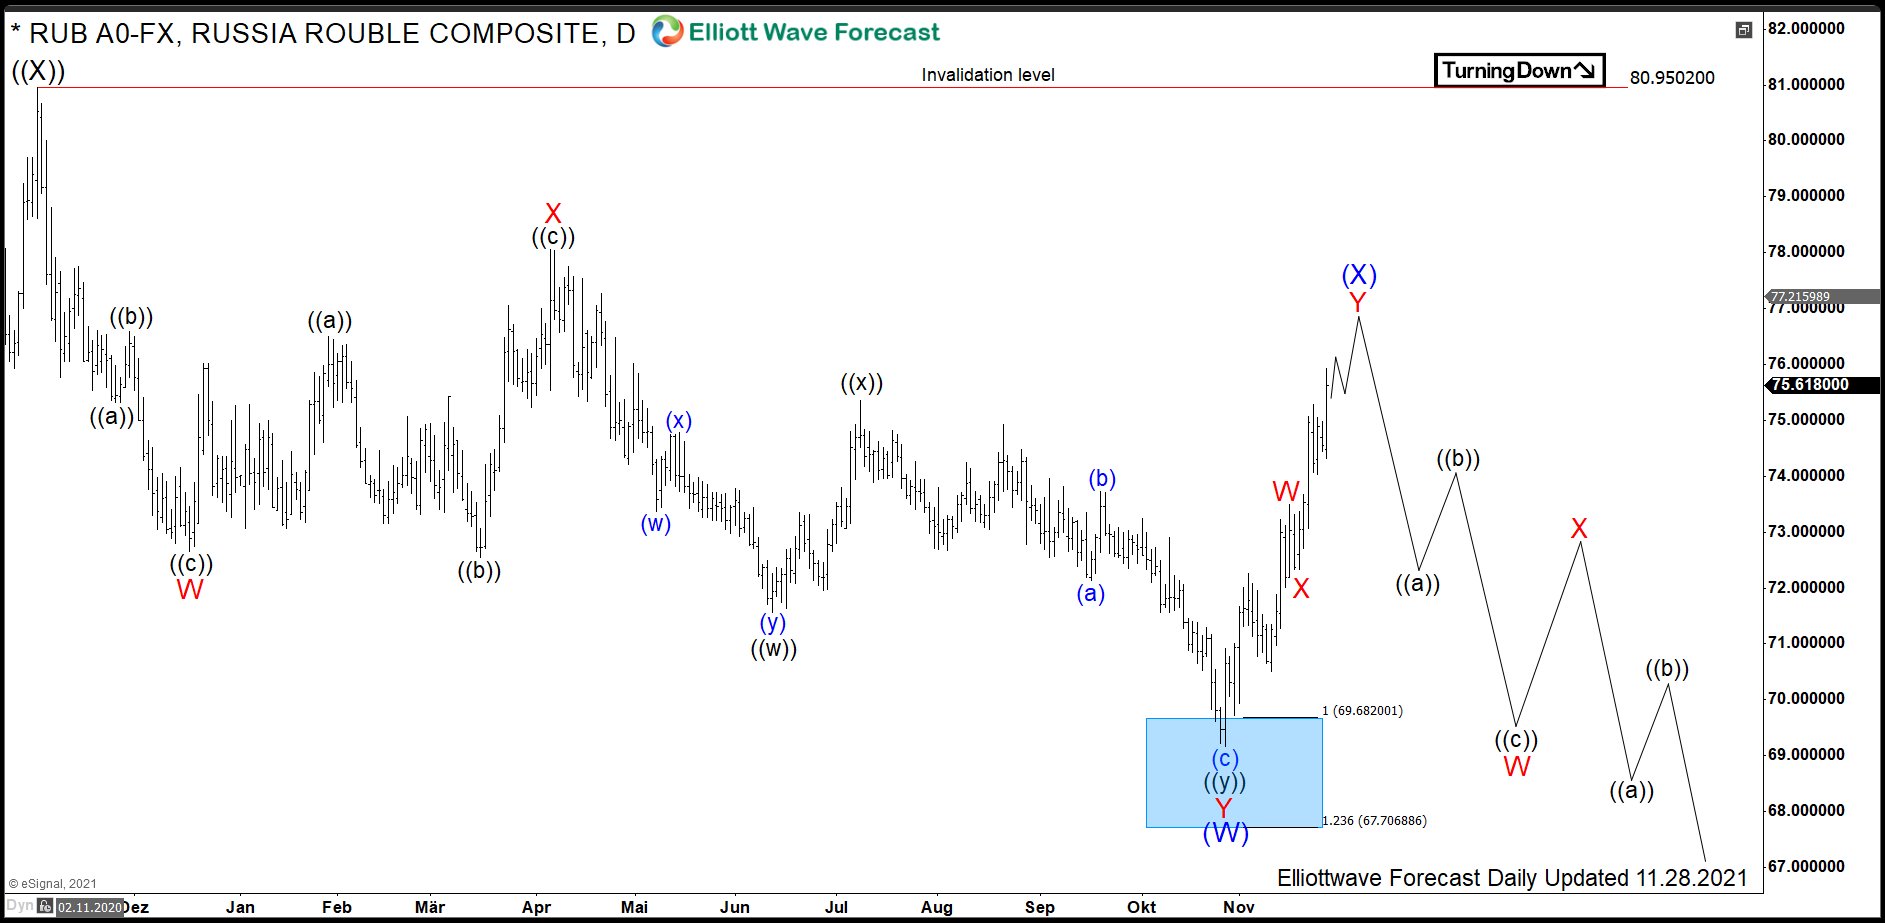
The daily chart below shows the ((Y)) leg lower of the red c wave within triangle in wave (IV) in more detail. From the November 2020 highs at 80.95, a cycle lower within wave ((Y)) is in progress. In shorter cycles, wave (W) has ended in October 2021 at 69.16 low. From there, a sharp connector higher in wave (X) should fail below November 2020 highs for another push lower within wave (Y) of ((Y)). The target to the downside is 66.07-56.87 area. There, USDRUB should find support for a bounce in red wave d higher. Otherwise, in case of breaking below 56.87 level, the triangle pattern in wave (IV) will need a reevaluation.
As an outlook, decline towards 66.07-56.87 area signifies the medium term Rouble strength. Therefore, traders can be looking to sell the bounces against 80.95 peak in 7 or 11 swings until USDRUB will not not reach at least 66.07 level. However, long term favors still the dominance of the Dollar over the currency of the Russian federation. Indeed, the larger cycle from 2008 looks still incomplete and 85.94 highs should still be reached in a longer run.
Source: https://elliottwave-forecast.com/forex/rouble-strength-within-triangle/