
Lumber, also known as timber, is a type of wood that has been processed into beams and planks. One can trade it in form of Random Length Lumber futures and options at Chicago Mercantile Exchange within the agriculture asset class under the ticker $LBS. In 2020, we saw commodities turning higher. Then, a medium term bounce in US Dollar has executed pressure on commodity prices in general and on agriculture prices in particular. As a matter of fact, the lumber has rallied into May 2021. It has printed the all-time highs at 1711.2. Then, it has seen the low in August of the same year at 448. Our initial article on Lumber has forecasted that. Here, we provide an updated view. Will that new large cycle higher make the housing market unaffordable to everyone?
Lumber Monthly Elliott Wave Analysis 11.16.2021
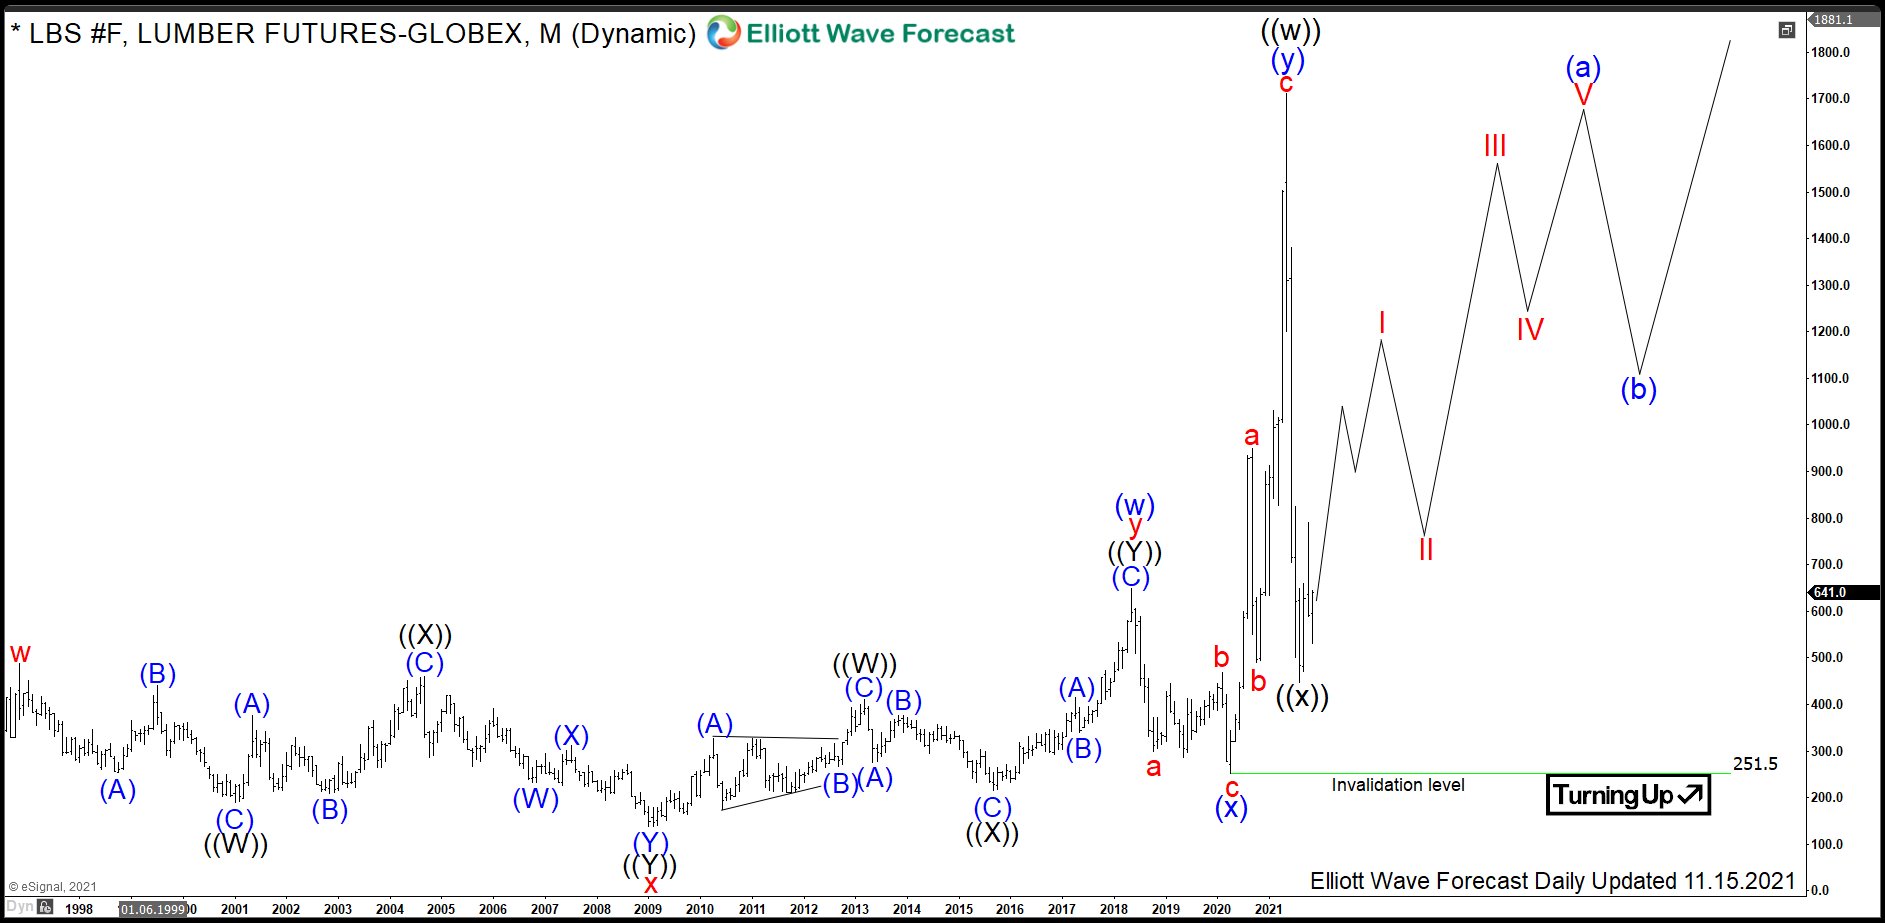
The monthly chart below shows the lumber front contract LBS #F. From the all-time lows, the prices have developed a cycle higher in blue wave (w) of a super cycle degree. It is a choppy and overlapping structure in series of 3. Therefore, the best count is to see the advance towards May 2018 highs at 648.5 as a double three pattern. From there, a correction lower in wave (x) has ended in April 2020 at 251.5. From the lows, a break to the new all-time highs has confirmed a new cycle higher in blue wave (y). Hereby, wave (y) has extended in 3 impressively strong swings towards the new all-time highs in May 2021 at 1711.2.
From the all-time highs in May 2021, a pullback has brought the prices down to 448 lows. The timber has lost 74% off the highs in only 3 months. Therefore, the grand super cycle in black wave ((w)) has ended in May 2021. It is the preferred view, that the correction in black wave ((x)) has ended in August 2021. While above the 448 lows, a new cycle in black wave ((y)) might be in the initial stages.
For 2022-2030, the expectations are to see more upside within a new cycle as wave ((y)). Investors can target the 100%-161.8% extension range based on the length of the wave ((w)) being 2165-3225 area.
Lumber Daily Elliott Wave Analysis 11.16.2021
The daily chart below shows in more detail the pullback from the all-time highs within wave ((x)) and first stages of the new larger cycle in wave ((y)). From the high at 1711.2, the decline is an Elliott wave zigzag pattern being a 5-3-5 structure. It has printed an important bottom at 448 low. From there, an impulse higher as wave ((1)) has ended in October 2021 at 789.6, the consolidation in wave ((2)) saw the low at 531.1. While above there, wave ((3)) might be in progress. In shorter cycles, wave ((3)) can reach towards 871.7-1082.4 area and possibly higher.

Source: https://elliottwave-forecast.com/commodities/lumber-prices-start-new-cycle/