
US Dollar has been rallying in the past few months ahead of the expected tapering by the Fed and rising yields. However, it doesn’t change the long term bullish outlook in Pound Sterling. The pullback in GBPUSD retested the breakout neckline of the inverse head and shoulder as the chart below shows. Further downside in near term remains possible, but the pair is close to major support levels.
GBPUSD Retesting Inverse Head and Shoulder Neckline
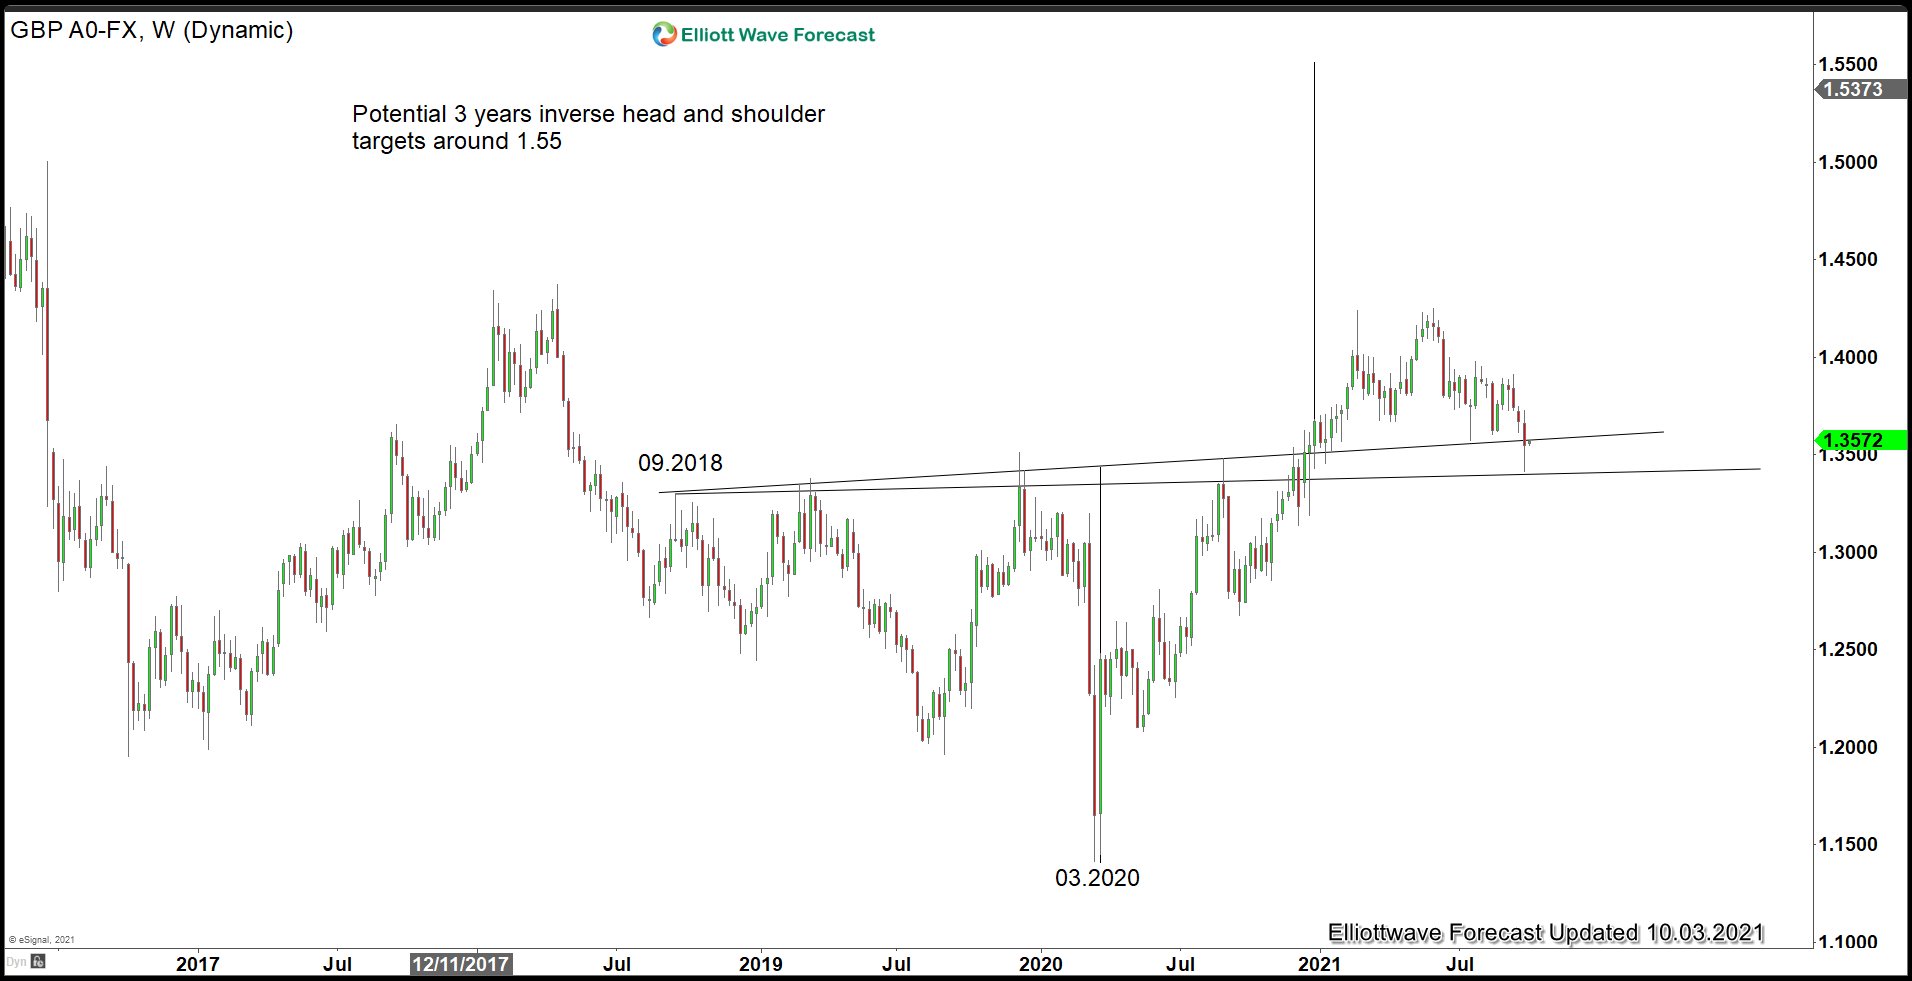
GBPUSD weekly chart above shows pair managed to break above 3 years inverse head and shoulder neckline. Current pullback from June 2021 peak has retested the breakout neckline. Although marginal low can’t be ruled out, the pair is getting closer to major support areas. Pair may have also ended the correction and start to resume the upside. Potential target is the distance between the head and neckline measured from the point of breakout which is 1.55.
GBPUSD Weekly Elliott Wave View
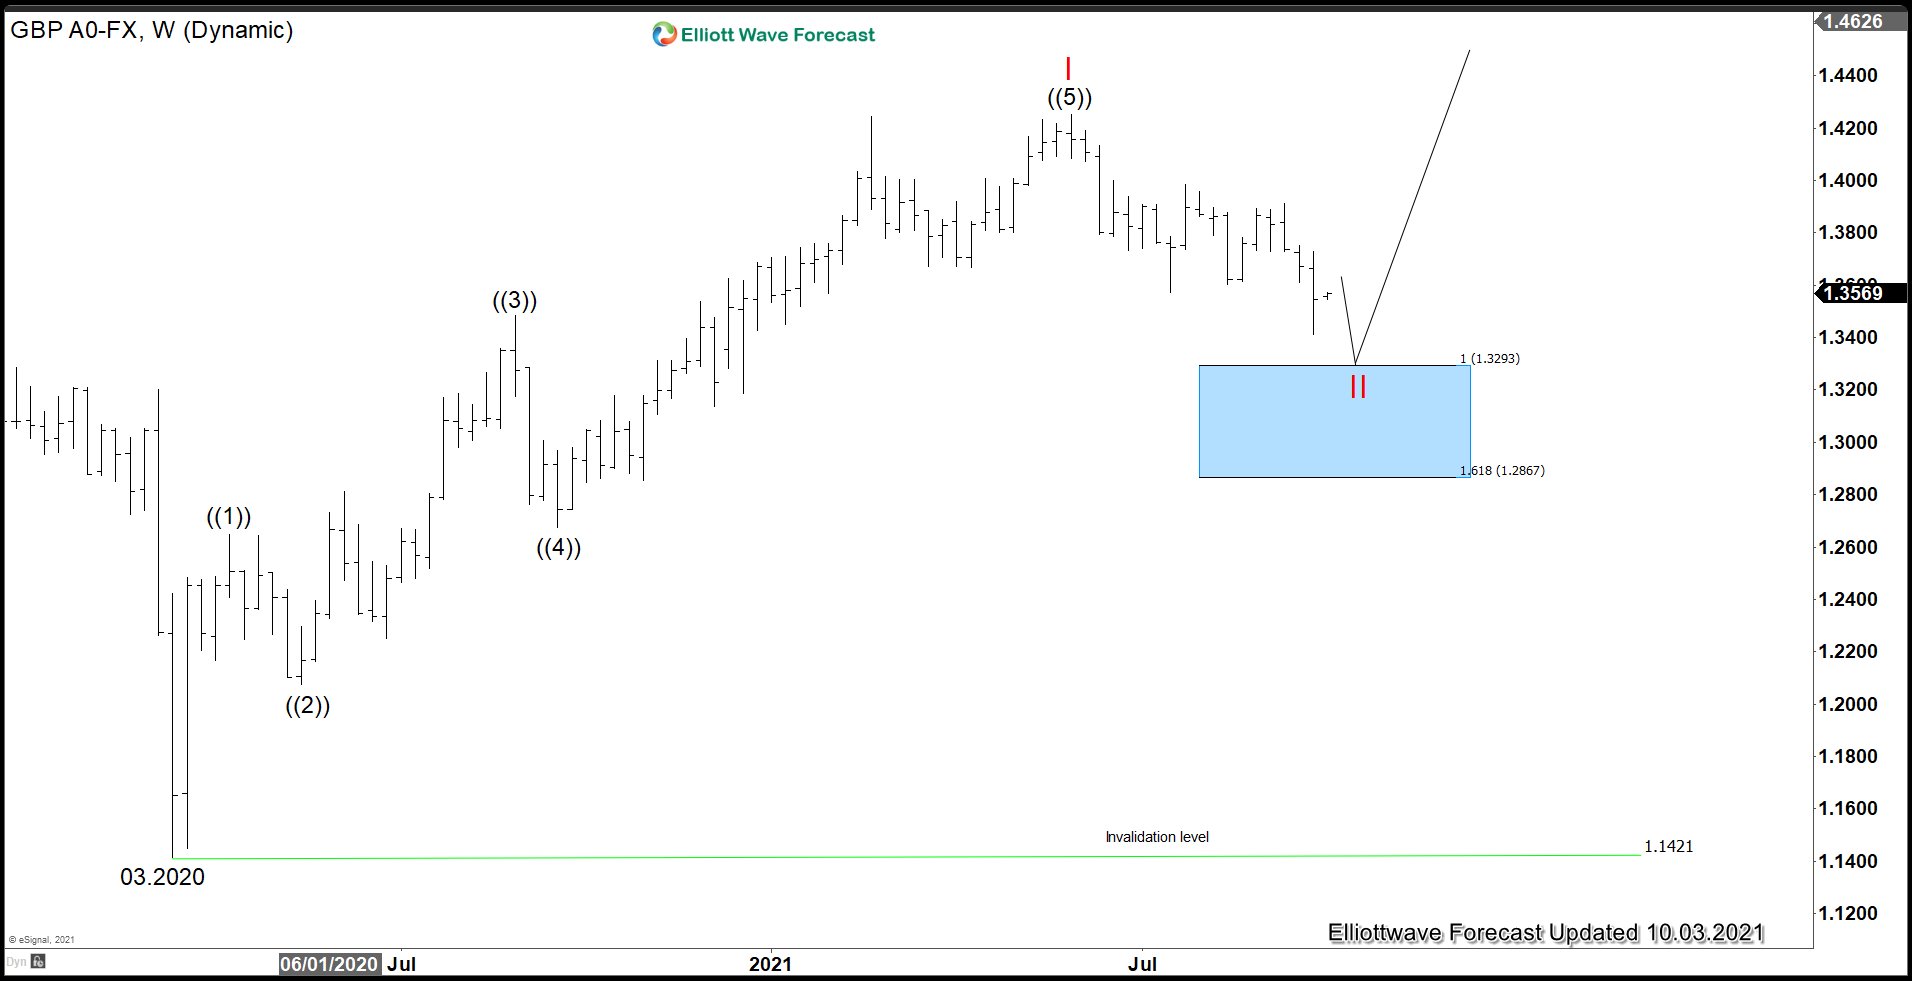
Weekly Elliott Wave chart of GBPUSD above shows pair is in the process of ending wave II pullback to correct cycle from March 2020 low. If pair continues the correction lower, then a potential support area is 100% – 161.8% Fibonacci extension from May 2021 peak at 1.286 – 1.329. From this blue box area, pair could resume the rally higher or rally in 3 waves at least.
Source: https://elliottwave-forecast.com/forex/gbpusd-close-to-support-levels/