
In this technical blog, we are going to take a look at the past performance of Facebook stock 1hr chart presented to members at elliottwave-forecast.com. In which the decline from September 01, 2021, high unfolded as Elliott wave impulse sequence thus suggested that it’s a continuation pattern & bounces should get fail in 3 or 7 swings structure. We will explain the structure & forecast below:
Facebook 1 Hour Elliott Wave Chart
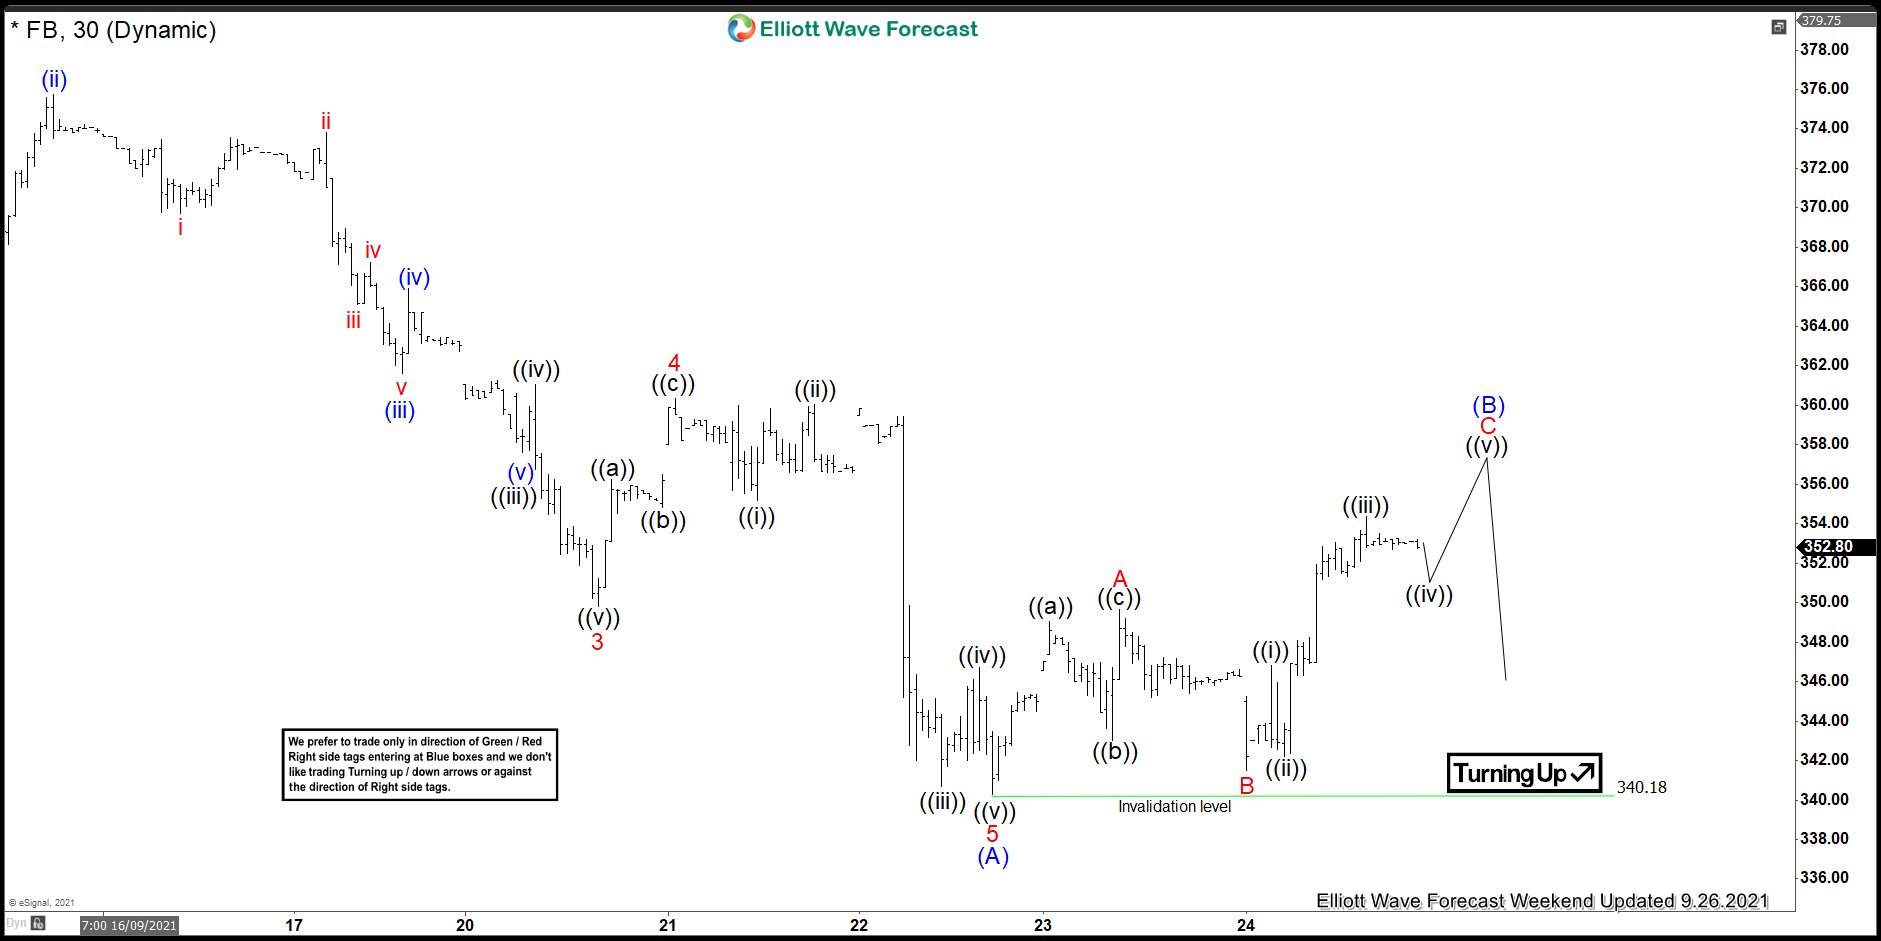
Here’s the 1hr Elliott wave Chart from the 9/26/2021 Weekend update. In which, the decline to $340.18 low ended 5 waves impulse sequence from the peak within wave (A). Up from there, the stock made a bounce in wave (B) to correct the cycle from 9/01/2021 high. The internals of that bounce unfolded as Elliott wave flat structure where wave A ended in 3 swings at $349.67 high. Then wave B ended at $341.48 low and started the C leg higher with the expectation of another push higher to end the flat correction.
Facebook Latest 1hr Elliott Wave Chart

This is the Latest 1hr view from the weekend update. In which the stock made the last push higher & end up failing lower as expected in another 5 waves impulse sequence suggesting that the (C) leg lower already started. Now as far as bounces fail below $355.17 high the stock is expected to see more downside towards $311- $300 area lower.
Source: https://elliottwave-forecast.com/stock-market/facebook-reacted-lower-ending-flat-correction/