
Since the crash of March 2020, all stocks have tried to recover what they lost and JNJ was no exception. Johnson & Johnson did not only recover the lost, but it also reached historic highs. In those days, we were looking for an entry in 155.33 – 156.93 area to reach a target above $176.00 dollars.
JNJ Old Daily Chart
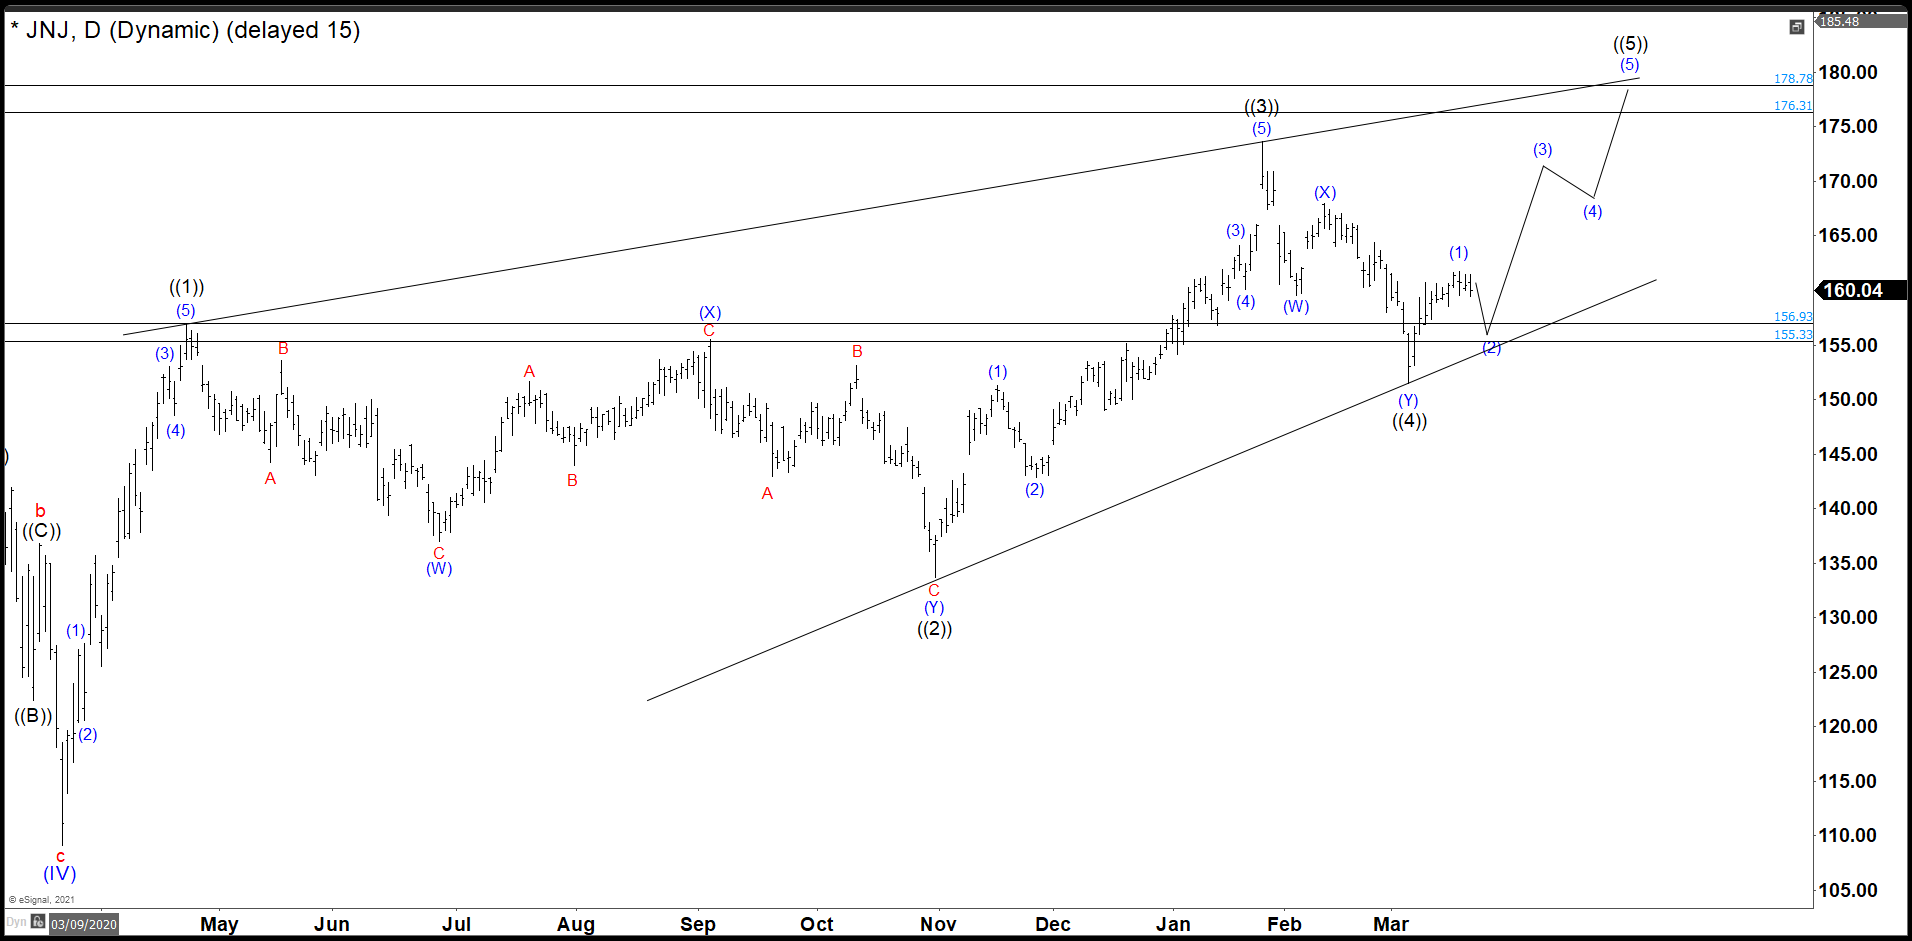
In this old chart, JNJ had a strong recovery in 3 swings. The wave ((3)) had its highest point at 173.69 rejected by the market in a double correction structure and overlapped the wave ((1)) zone to end the wave ((4)). We were expecting one swing higher to complete wave ((5)) as an Ending Diagonal. (If you want to learn more about Elliott Wave Theory, please follow this link: Elliott Wave Theory).
JNJ Old Daily Chart
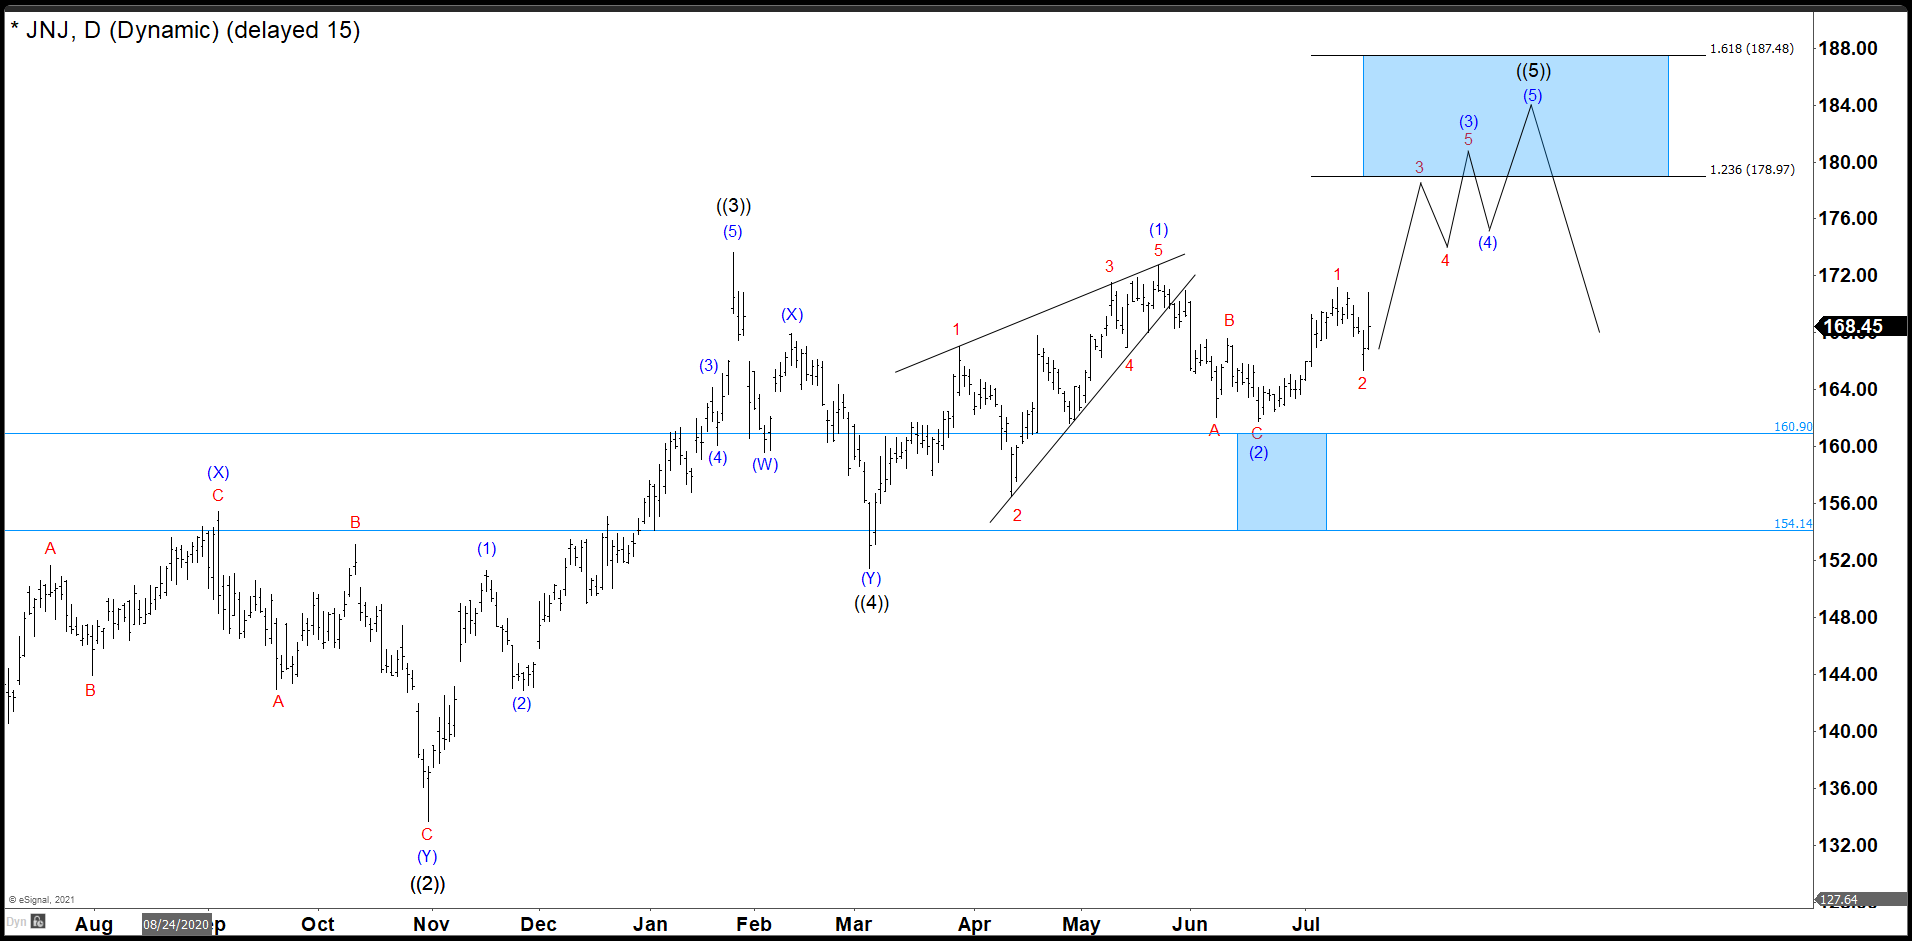
The share price continued to rise until reach 172.79 which we called wave (1) doing a Leading Diagonal (LD) structure. Before that in April, wave 2 in red drop to our minimum entry at 156.93 and bounce to complete the LD. From there, we have a clear correction as a zig zag wave (2) missing our ideal second entry for a few cents and the possible target to complete wave ((5)) came in 178.97 – 187.48 area.
JNJ Old Daily Chart
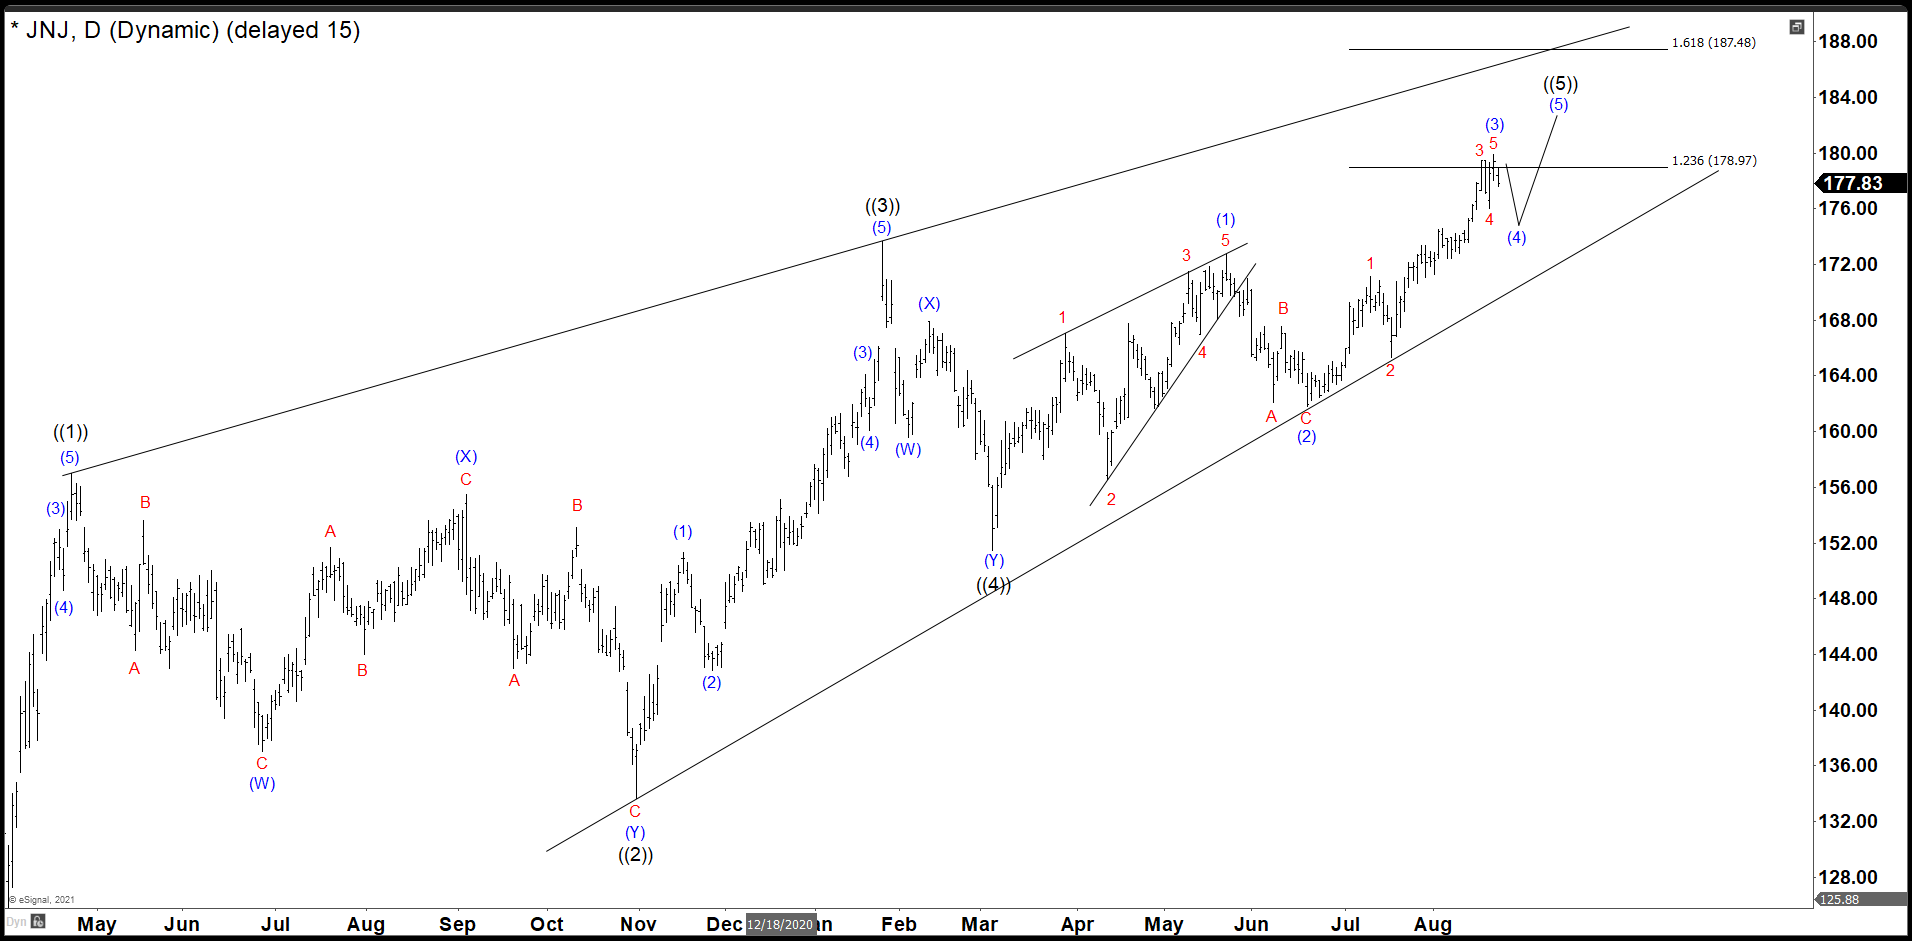
We were calling wave (3) of ((5)) at 179.92. That meant we achieved our 178.97 minimun target from 156.93 gave us a 14.04% return and we were expecting one more swing high to complete 5 waves up and the daily ending diagonal with wave ((5)).
JNJ Daily Chart
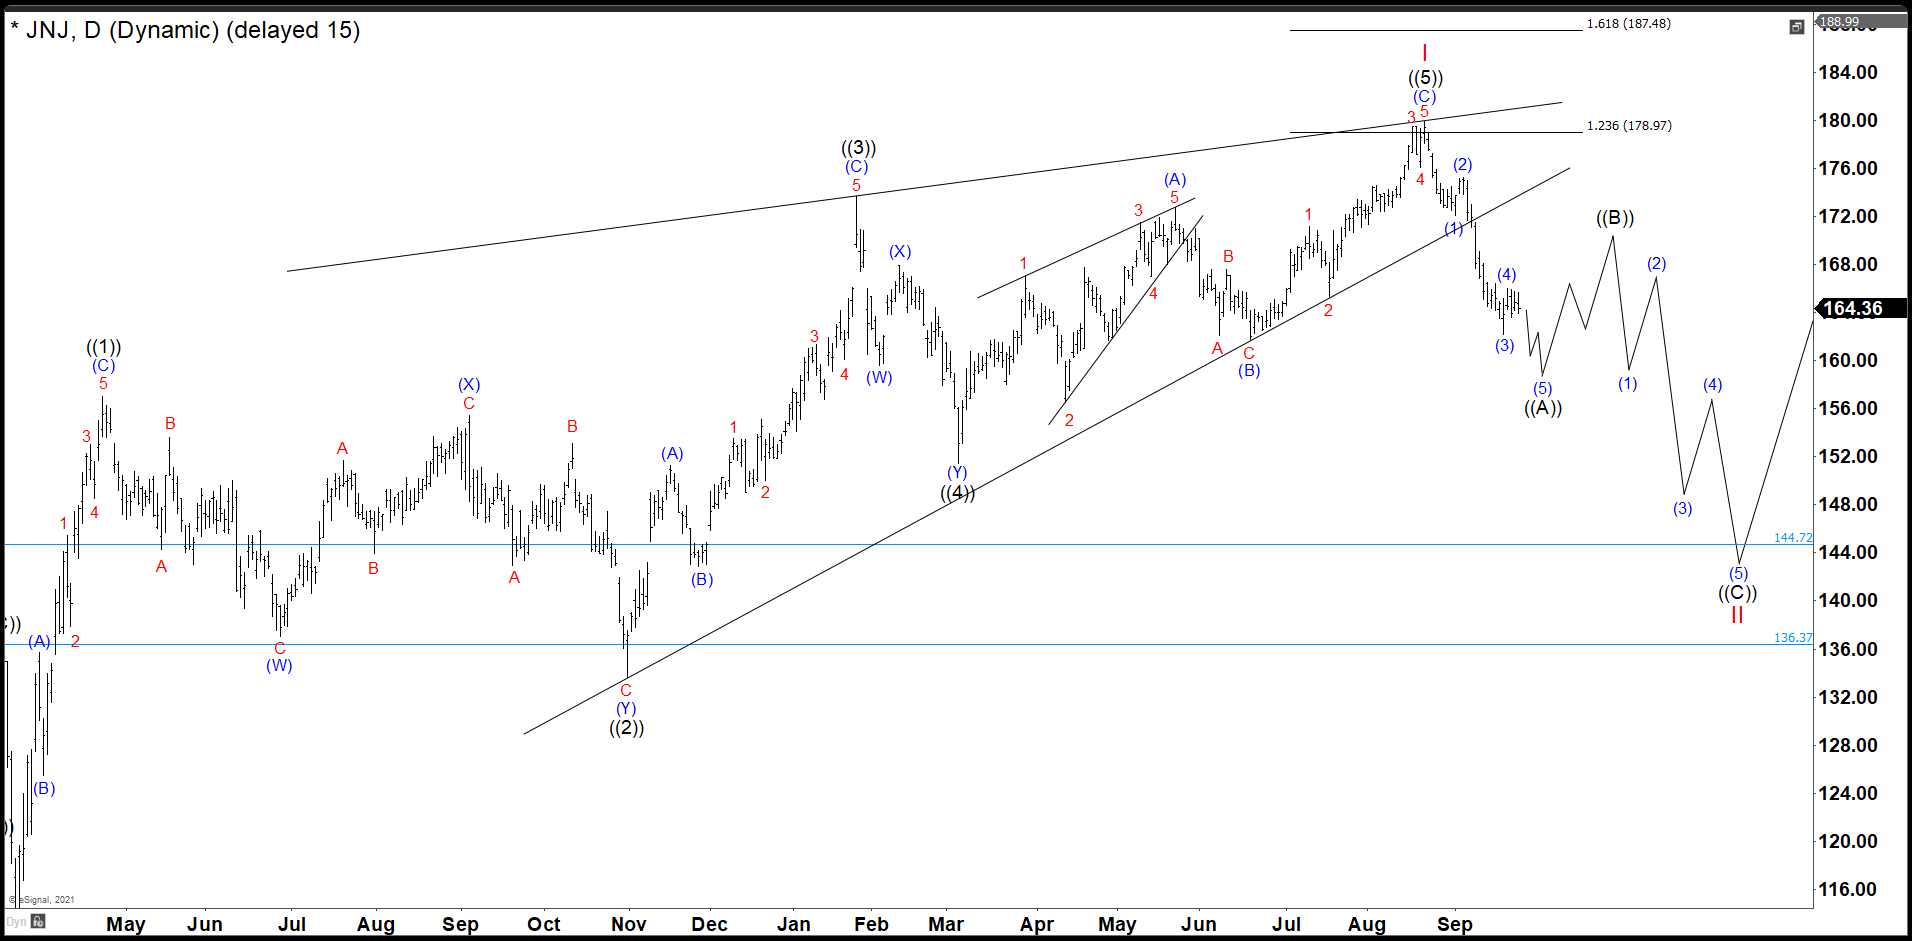
JNJ missed a new high and the ending diagonal with lesser degree structure as 5-3-5-3-5 have to be changed to 3-3-3-3-3 as you can see in the update. The rejection has been strong enough to give us the conviction that wave II is in progress and wave I finished at 179.92.
In first instance, we will consider an ((A)), ((B)), ((C)) zigzag correction to complete wave II. The wave ((A)) is taking the form of an impulse. We need one more wave that breaks 162.17 to reaffirm the idea of the impulse. Then we should see a corrective bounce as wave ((B)) and then continue falling to complete ((C)). At the moment, wave II should find support in the 144.72 – 136.37 ideal area where it would give us new buying opportunities again.
Source: https://elliottwave-forecast.com/stock-market/jnj-ending-diagonal-completed/