
Hello fellow traders. In this technical blog we’re going to take a quick look at the Elliott Wave charts of Bitcoin ($BTCUSD ) published in members area of the Elliottwave-Forecast . As our members know, we have had a lot of good buying opportunities BTCUSD while it was trading within the cycle from the 2018 low ( 3127.5). Recently Bitcoin has given us correction of the cycle from the 28707.5 low. We were calling the decline in the Cryptocurrency. In further text we’re going to explain the forecast and Elliott Wave Pattern and Forecast.
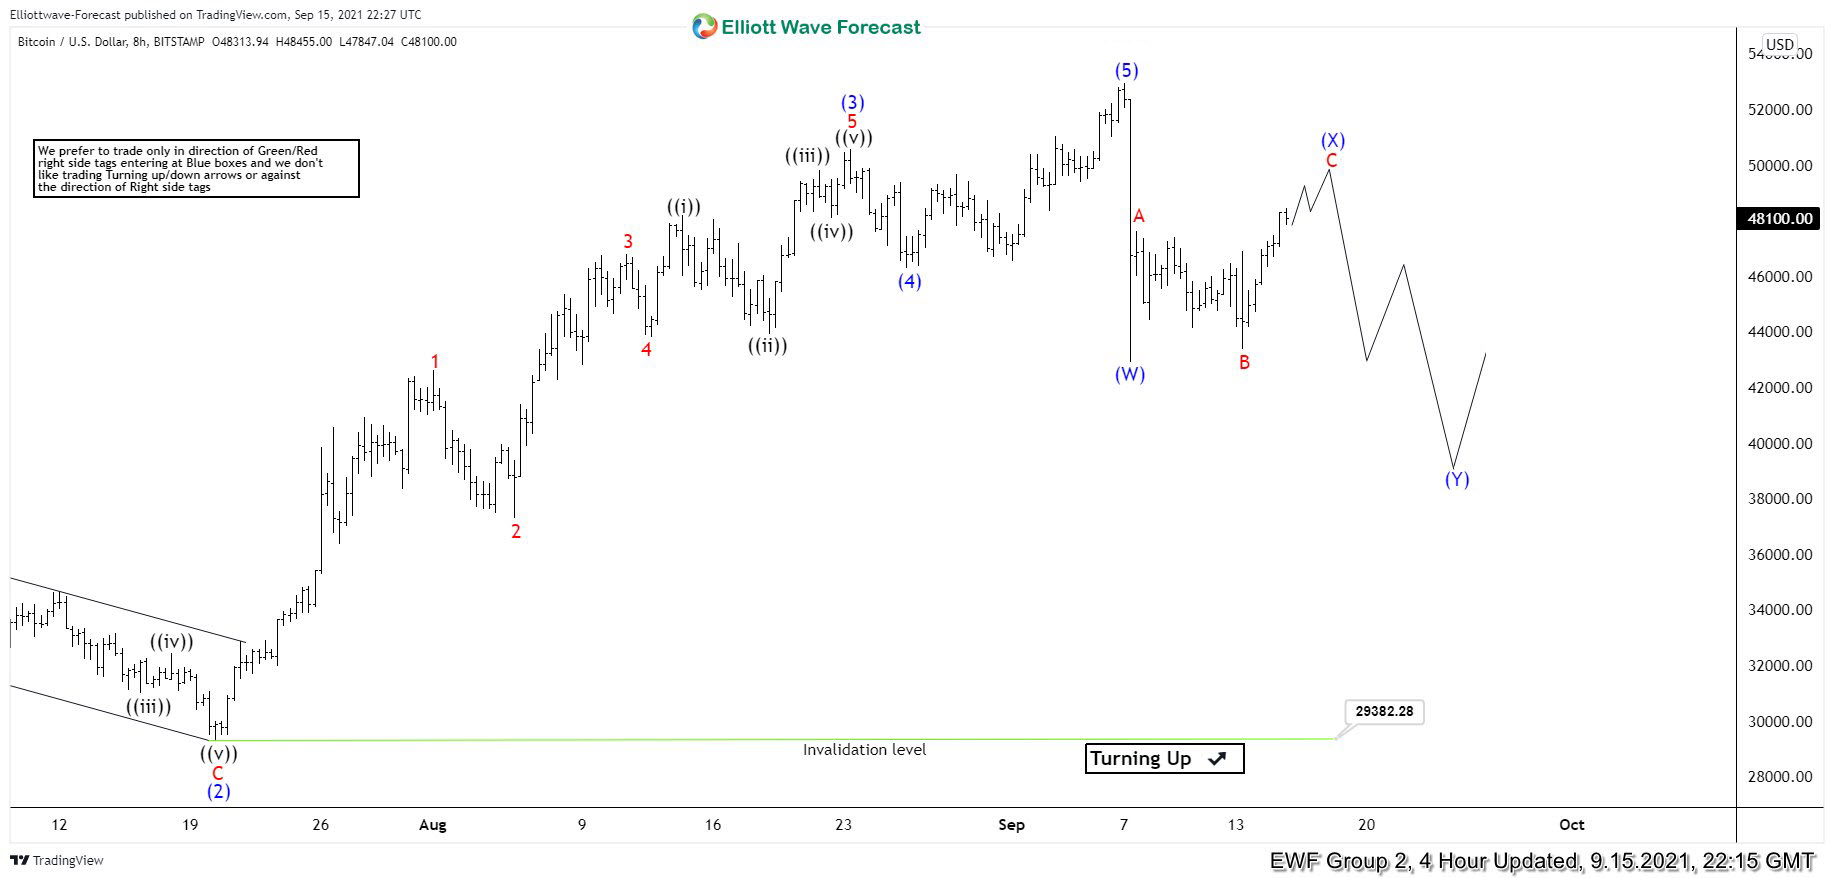
Bitcoin ( $BTCUSD ) 4 Hour Elliott Wave Analysis 9.15.2021
As we can see on the chart below , Bitcoin ended 5 waves up in the cycle from the 28707.5 low. BTUCSD giving us now correction against that low. Current pull back looks incomplete at the moment and we believe cryptocurrency should give us another leg down- (Y) blue as soon as (X) blue connector completes.
Reminder: You can learn more about Elliott Wave Patterns at our Free Elliott Wave Educational Web Page.
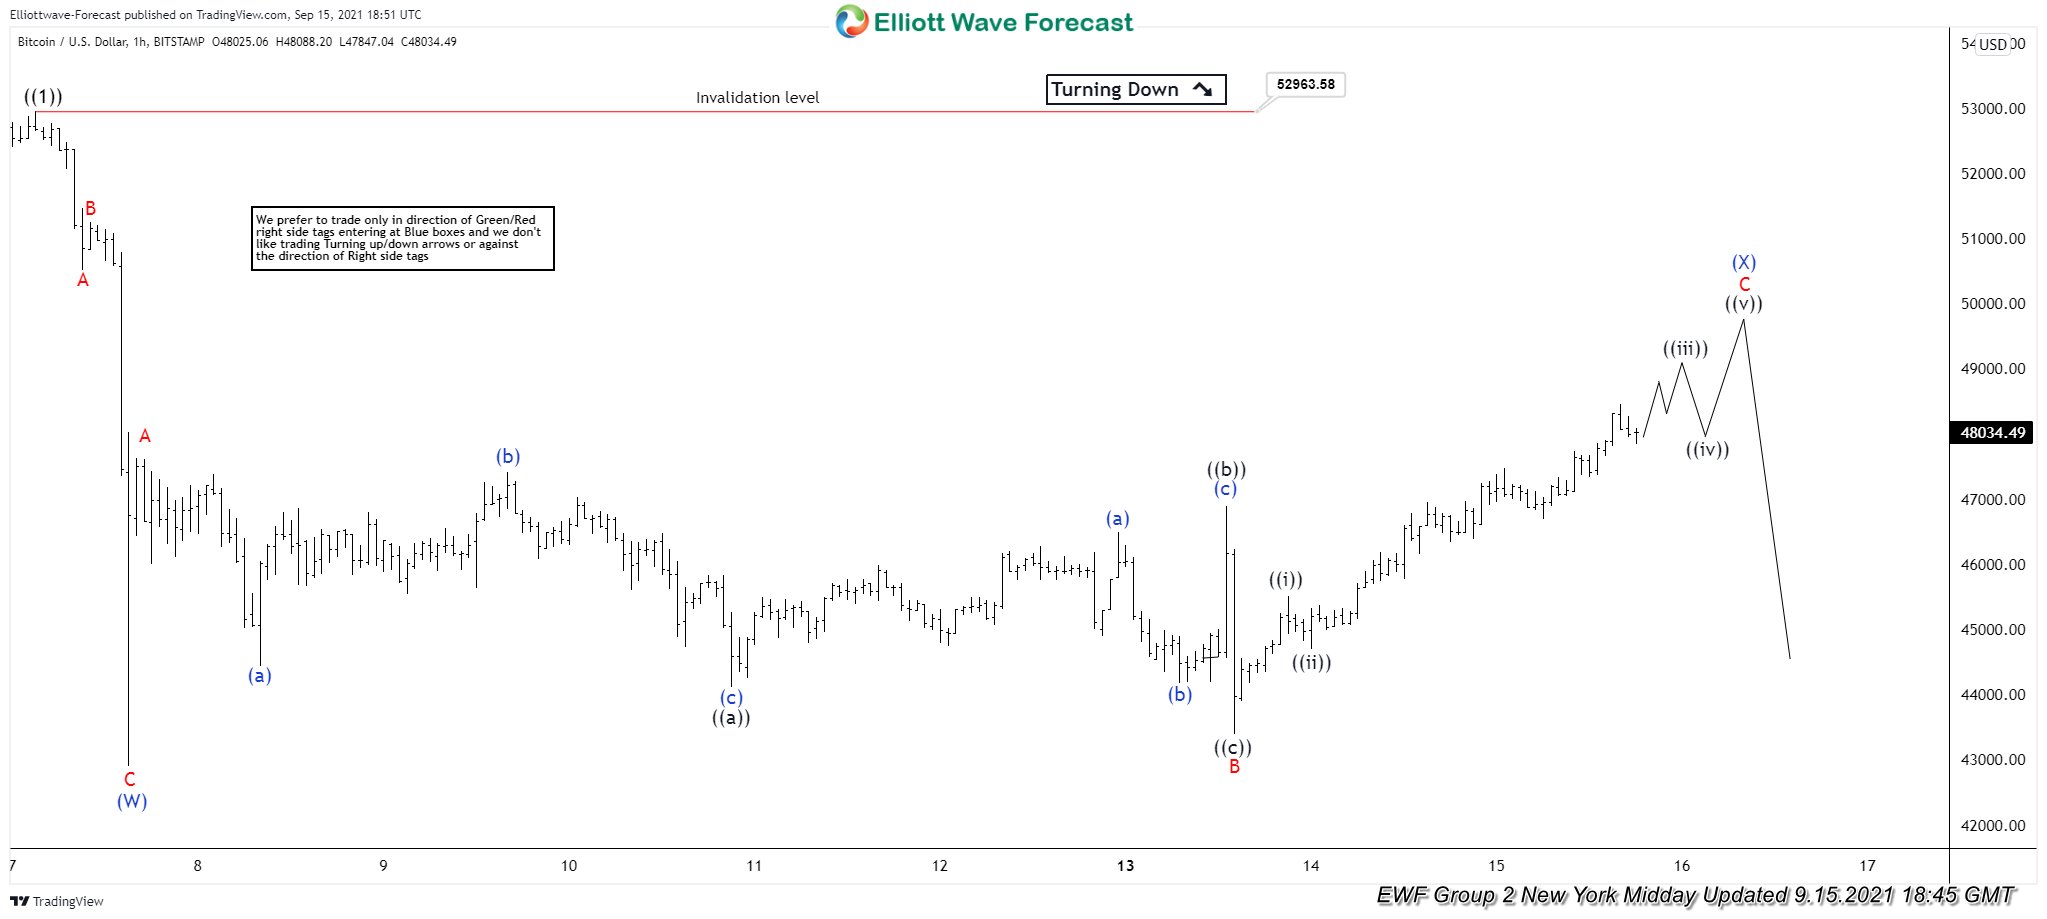
Bitcoin ( $BTCUSD ) 1 Hour Elliott Wave Analysis 9.15.2021
Cryptocurrency is giving us short term recovery against the 52963.5 peak. (X) connector still looks incomplete. We expect to see more short term strength within cycle from the September 13th low. We expect the price to reach approximately 48094-49188 before turn lower takes place. Although decline was expected, overall view is bullish in BTCUSD, consequently we recommended members to avoid selling it and rather wait for extremes to be reached before buying it again.
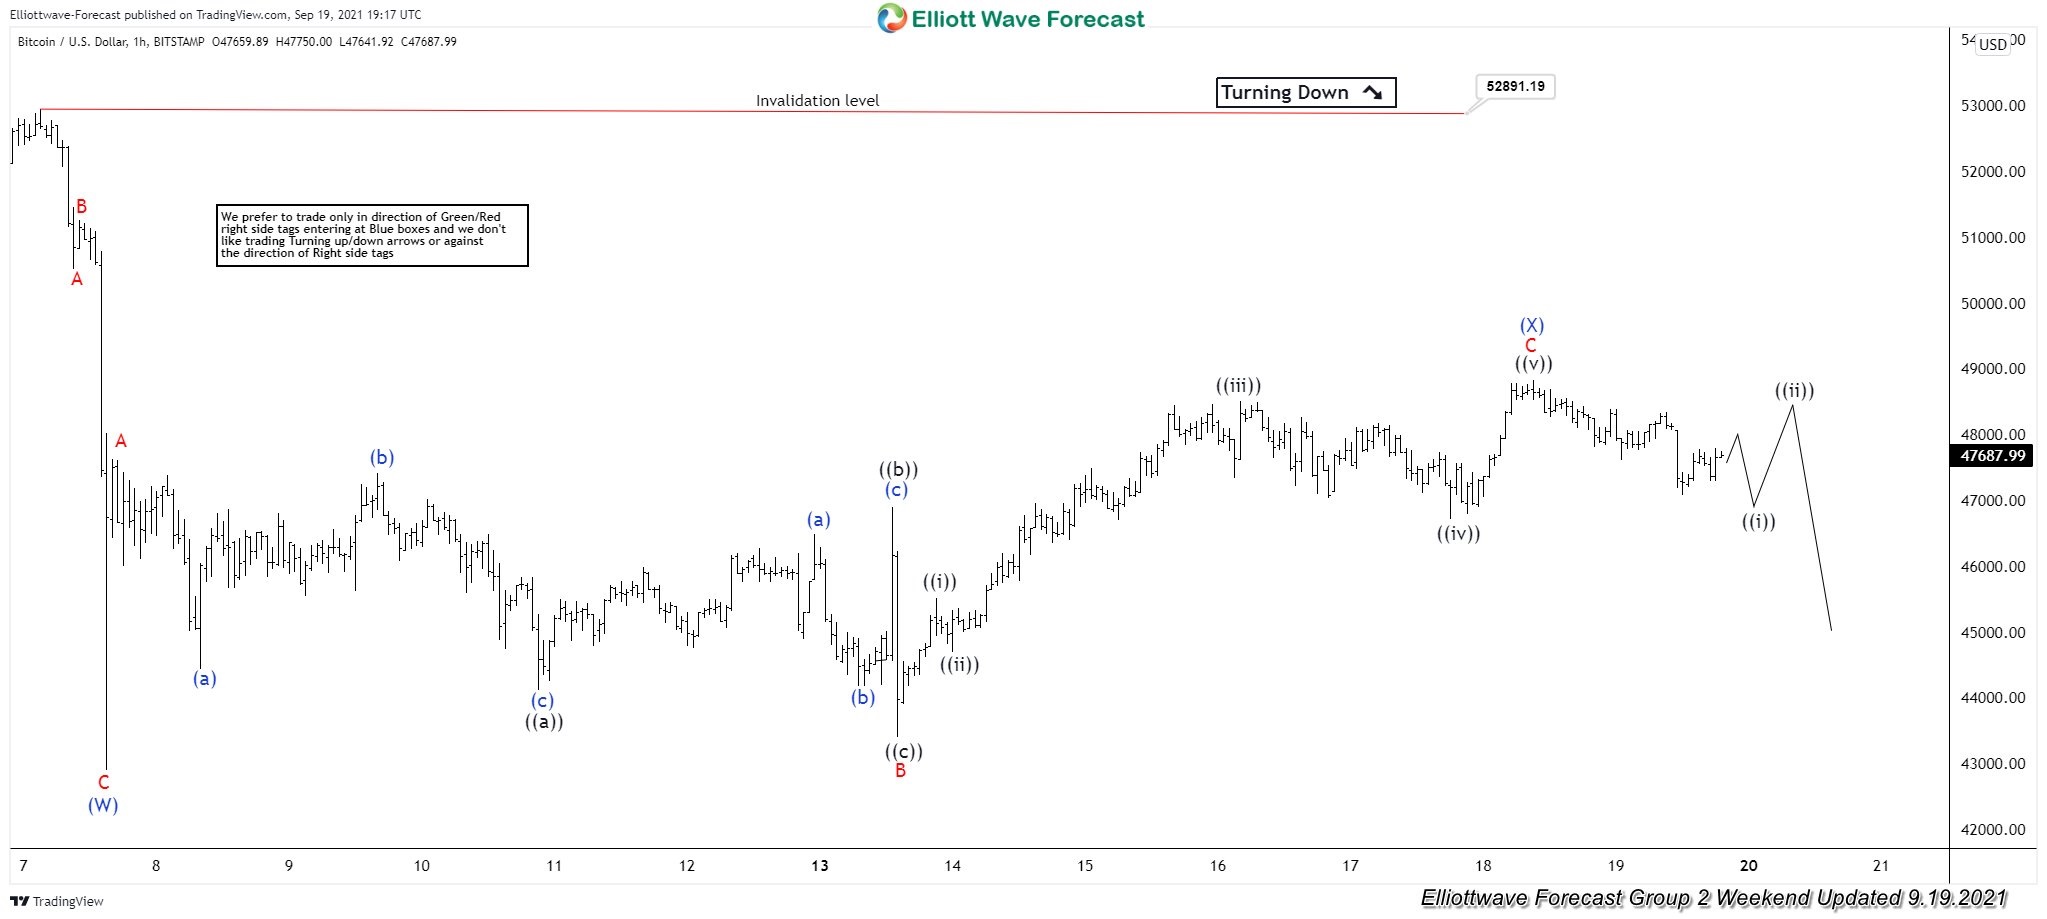
Bitcoin ( $BTCUSD ) 1 Hour Elliott Wave Analysis 9.15.2021
We got more upside within the cycle from the Sep 13.low which eventually completed as 5 waves rally as we expected. Now we are calling (X) blue connector completed at the 48846 high. We would like to see further separation lower against that level. The price should make break below (W) blue low -42903 to confirm (Y) leg is in progress. We would like to be buyers again once the price reaches the extreme zone from the 52891.19 peak.
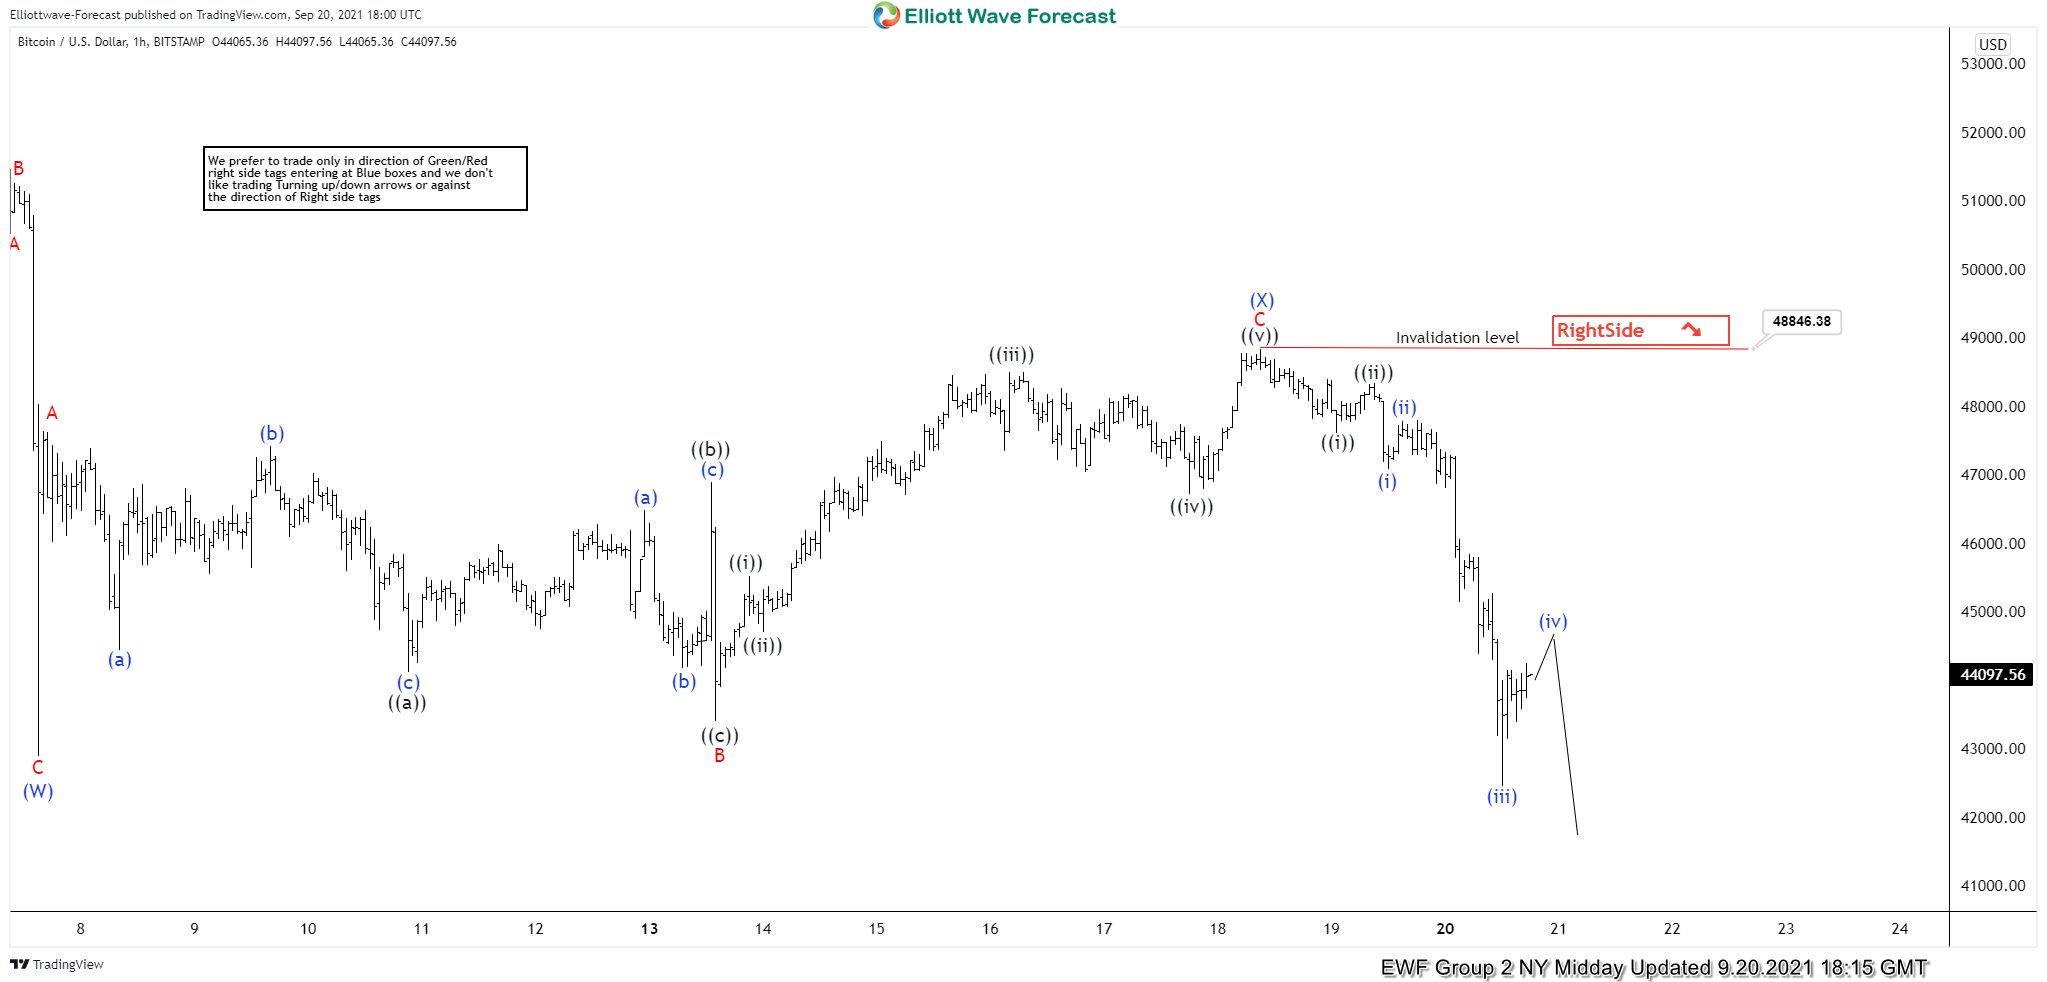
Bitcoin ( $BTCUSD ) 1 Hour Elliott Wave Analysis 9.15.2021
The price held below 48846 high and made further separation down as we expected. Eventually the price broke the 42903 low and confirmed next leg down is in progress. Crypto is now bearish against the 48864 in near term. We would like to see at least another push down to complete cycle from the peak.
Keep in mind that market is dynamic and presented view could have changed in the mean time. You can check most recent charts in the membership area of the site. Best instruments to trade are those having incomplete bullish or bearish swings sequences. We put them in Sequence Report and best among them are shown in the Live Trading Room.
Elliott Wave Forecast
Source: https://elliottwave-forecast.com/elliottwave/bitcoin-btcusd-calling-decline/