
Johnson Controls International plc, (JCI) engages in engineering, manufacturing, commissioning & retrofitting building products & systems in United States & globally. It operates in four segments like Building Solutions in North America, Building Solutions EMEA/LA, Building Solutions Asia-Pacific & Global products. It comes under Industrials sector & trades as “JCI” ticker at NYSE.
JCI favors impulse rally in weekly against in III of (III) against October-2023 low. It favors upside in (5) targeting $151.45 – $159.38 area to end ((3)), while high comes with momentum divergence. We like to buy the pullback in 3, 7 or 11 swings in ((4)) later at extremes.
It ended (I) at $81.77 high in December-2021 & (II) at $45.52 low in July-2022. Above there, it placed I of (III) at $69.60 in January-2023, II at $47.90 low in October-2023 & favors rally in III. Within III, it ended ((1)) at $91.14 high, ((2)) at $68.03 low & favors upside in ((3)). Within ((1)) of III, it ended (1) at $74.23 high, (2) at $64.31 low, (3) at $87.16 high, (4) at $75.32 low & (5) at $91.14 high. Every time correction hits the blue box area, it reacted higher to extend bull run.
JCI – Elliott Wave Latest Weekly View:
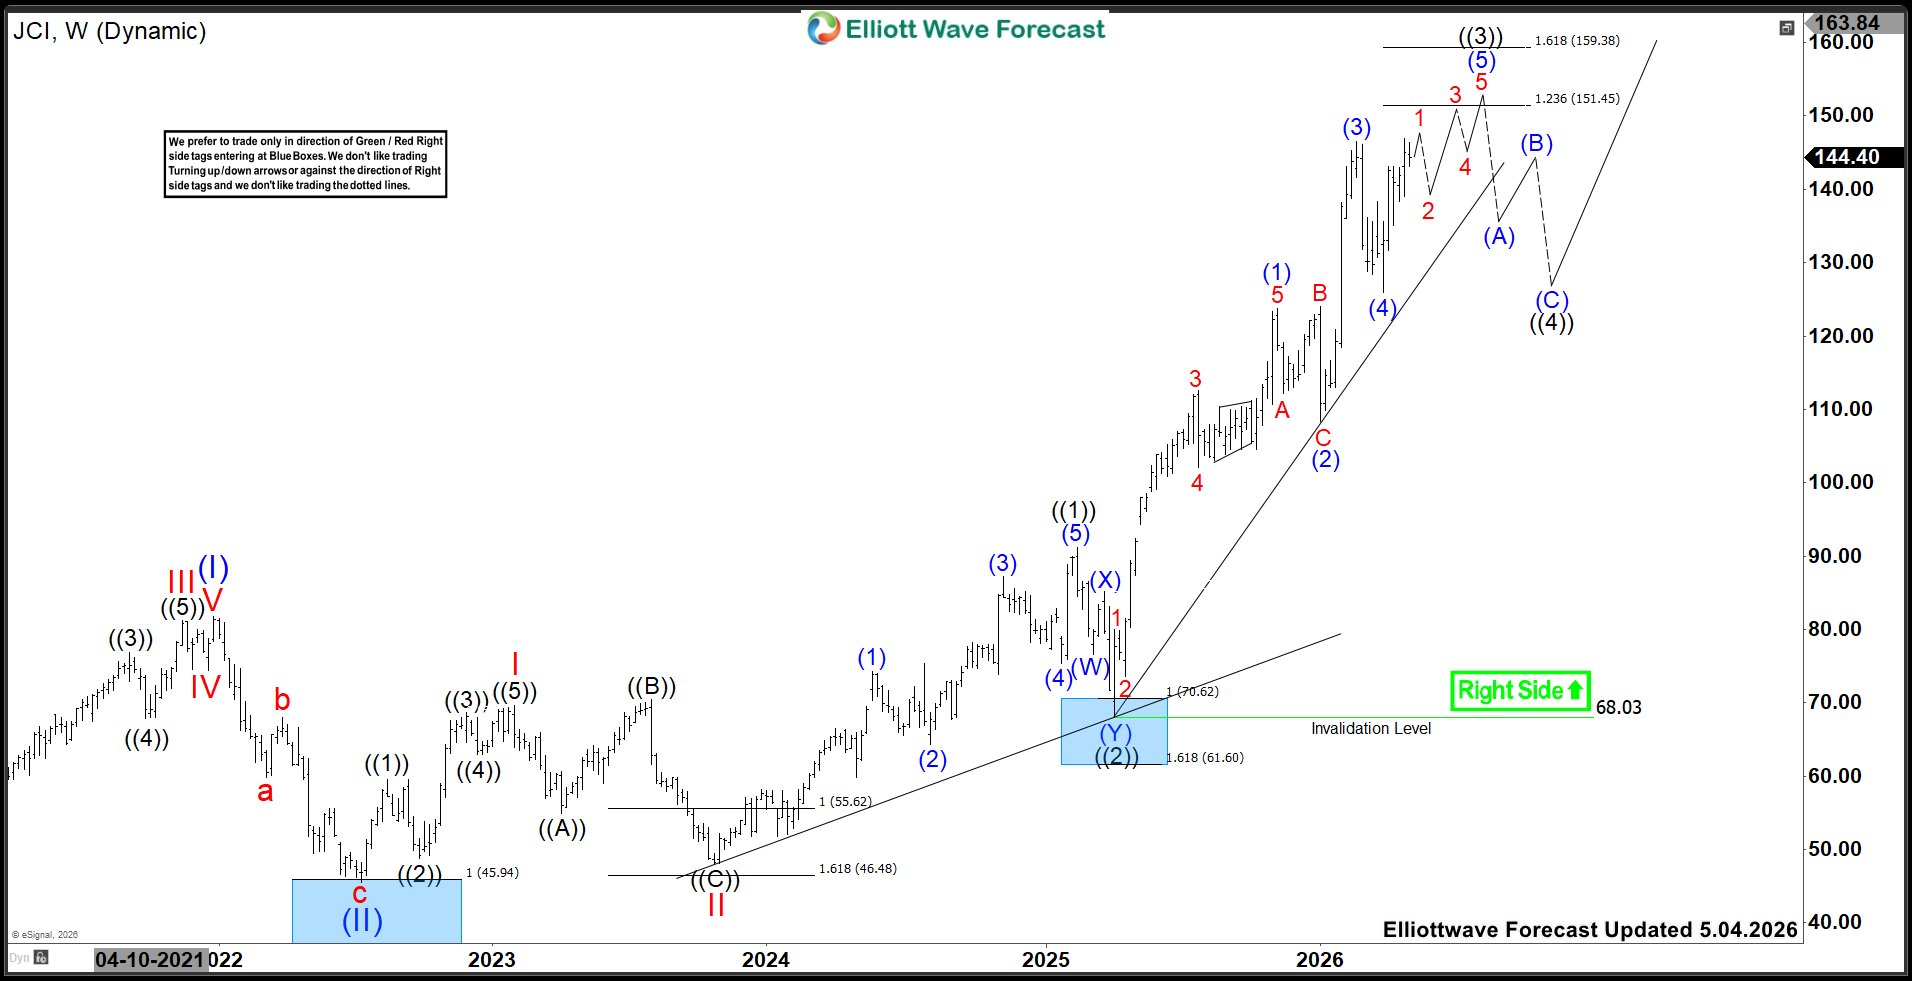
It ended (1) of ((3)) at $123.78 high, (2) at $108.41 low, (3) at $146.49 high, (4) at $125.91 low & favors upside in 1 of (5). It already broke to new high in (5) above $146.49 high of (3) & expect rally into $151.45 – $159.38 area to finish ((3)). The rally in ((3)) already crossed above 1.618 extension of ((1)) as $138.36 & expect to finish around $154.98 as 2.0. The high within ((3)) came with momentum divergence, indicates the trend may mature & pullback possible. So, chasing at current level cane be risky & buyers should wait for ((4)) pullback. The break below trendline will confirm the pullback. If it managed to erase the momentum divergence, then it can extend ((3)) in alternate scenario.