
Since the crash of March 2020, all stocks have tried to recover what they lost and JNJ was no exception. Johnson & Johnson did not only recover the lost, but It also reached historic highs. Now, we are going to try to build a wedge from the March 2020 lows with a target above $176.
JNJ Old Daily Chart
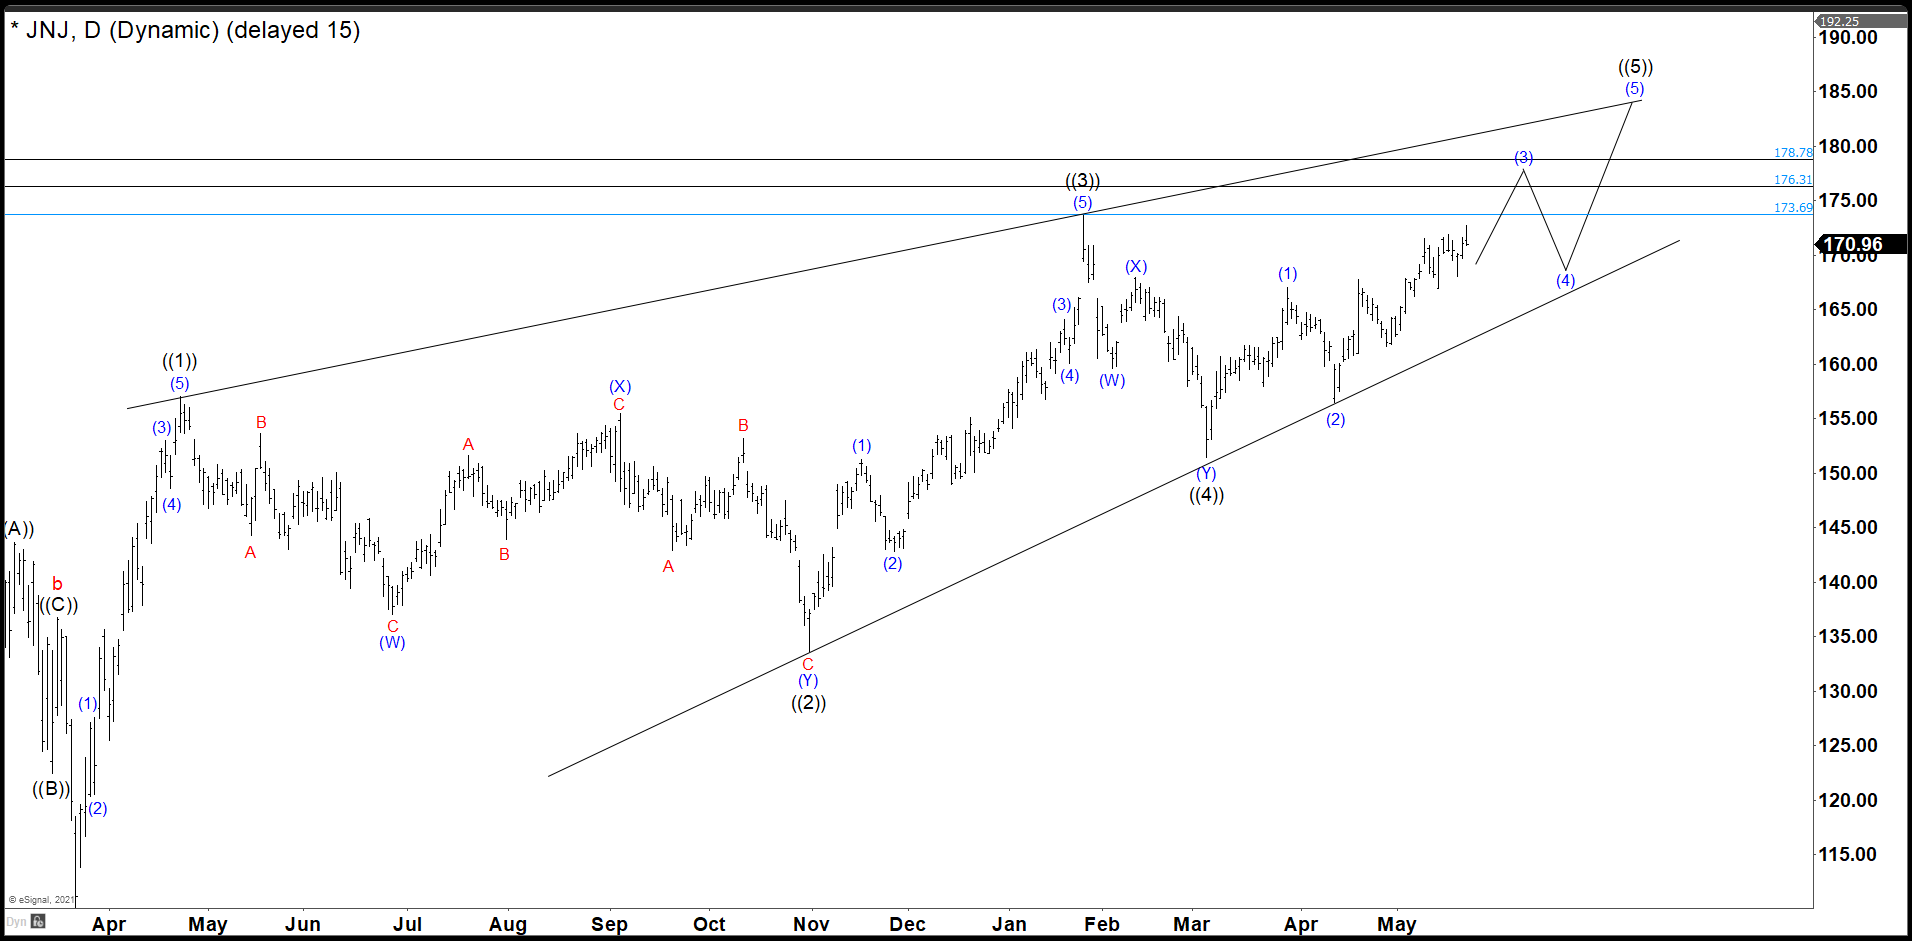
In the last chart we can clearly see that after the fall of March 2020, JNJ had a strong and rapid recovery in 3 swings. The wave ((3)) had its highest point at 173.69 where JNJ was rejected by the market. This rejection did another double correction structure and overlaps the wave ((1)) zone to end the wave ((4)) and from here it should continue higher to complete wave ((5)) as a diagonal. (If you want to learn more about Elliott Wave Theory, please follow this link: Elliott Wave Theory).
JNJ Daily Chart
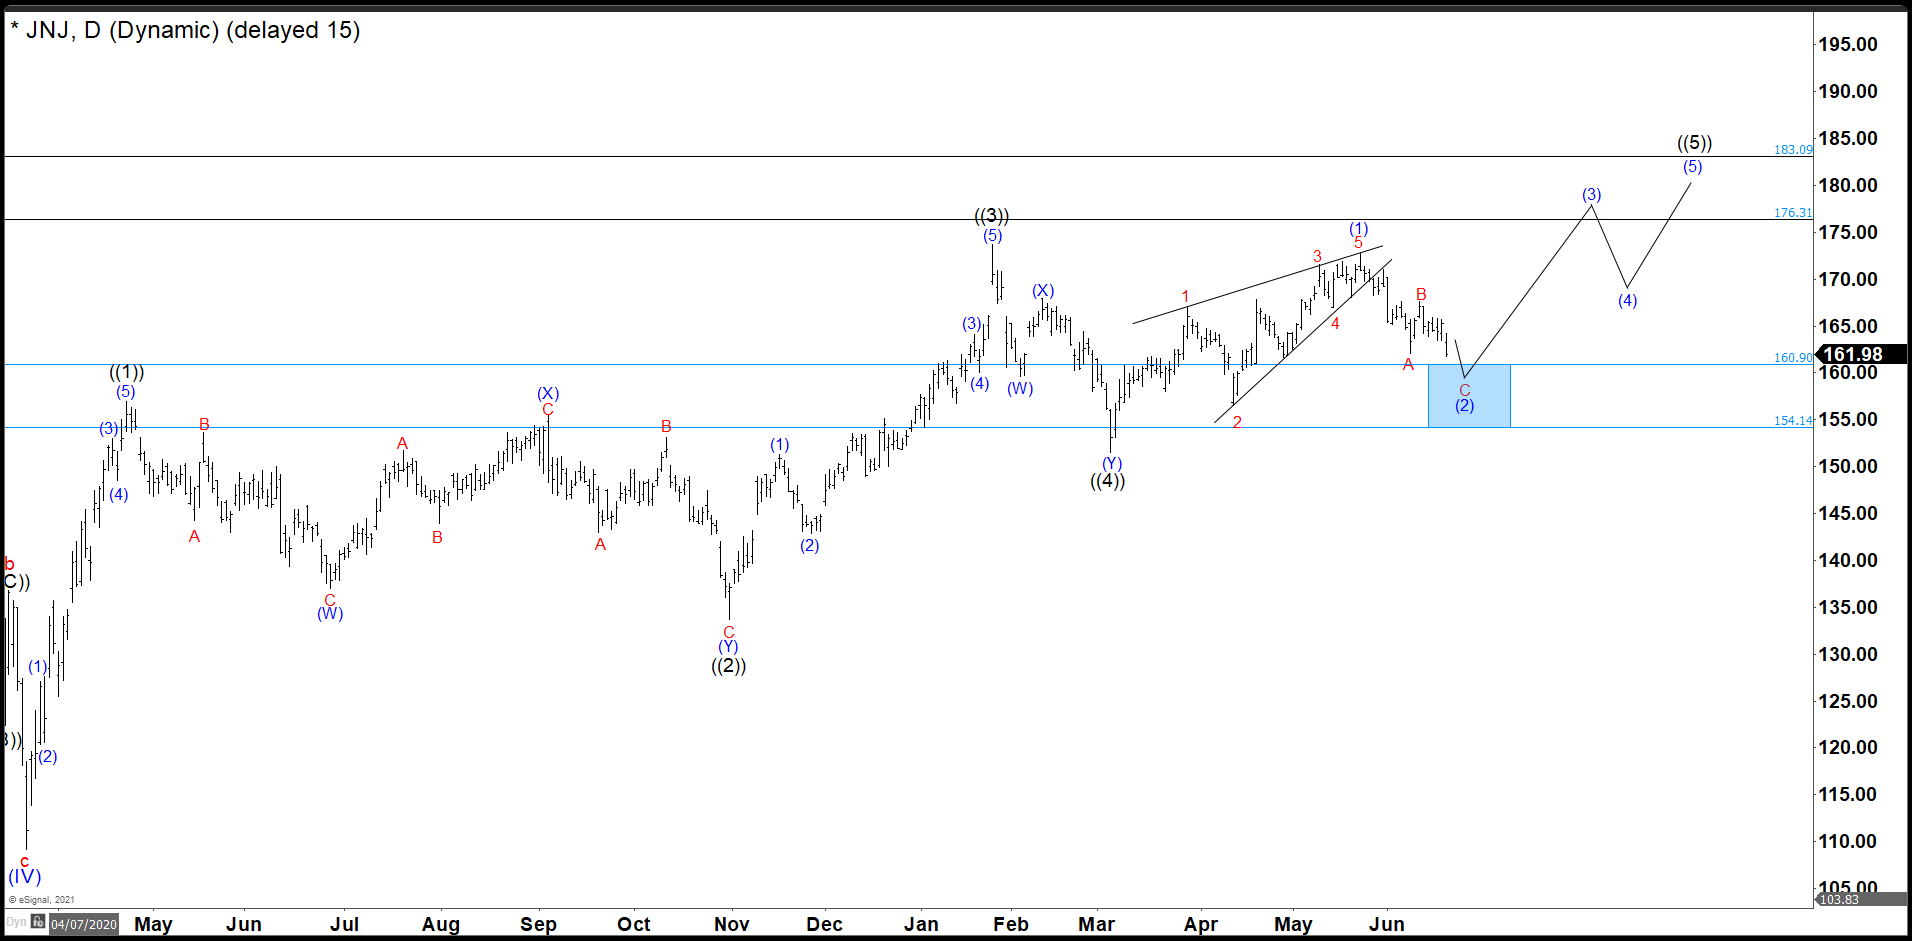
As days passed, the share price continued to rise until reaching 172.79, which we call wave (1) and you can see the structure are Leading Diagonal. From there, we have a clear correction in a zig zag structure as wave (2). This pullback has been deep, and it has broken the trendline. It does not matter for our goal to complete an ending diagonal from march low. That count is valid as we stay above 151.50. Short term, we are in wave C of (2) and it should continue lower to the blue box (160.90 – 154.14) showing 2 swings more to complete the current structure. A bounce from there will confirm the ending of wave (2) and the market should push to the upside.
Source: https://elliottwave-forecast.com/stock-market/jnj-ending-abc-correction-wave-2/