
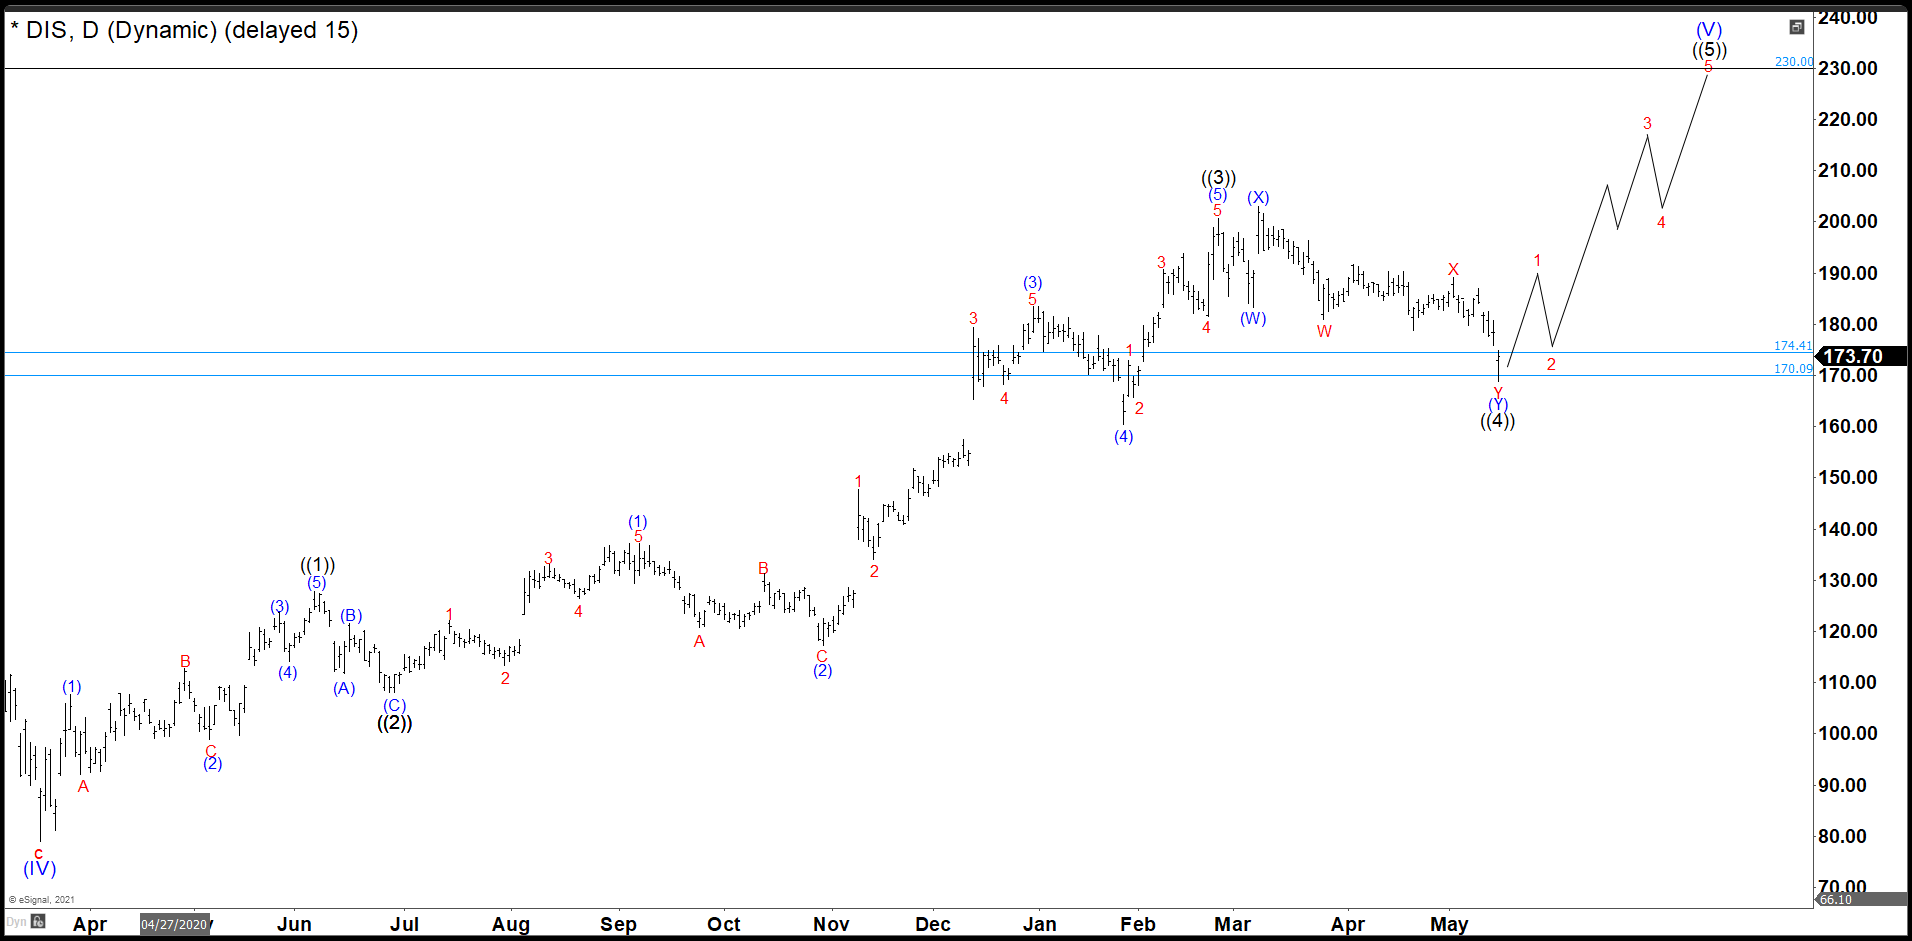
Since the crash of March 2020, all stocks have tried to recover what they lost, and Disney was no exception. Disney did not only recover the lost, but It also reached historic highs. Now, we are going to try to build an impulse from the March 2020 lows with a target around $230. Target measured from 0 to 2019’s high projected from March’s low, equal legs. Since we begin with this analysis on February 13th, we bought the share in 160.97 – 165.89 area.
Disney Old Daily Chart
As we see in the daily chart, the waves ((1)), ((2)) and ((3)) of the impulse are done. We hit our first target at 190.88. The target gave us a return of +18.58% from 160.97. Disney dropped showing us that an irregular flat took place in a double correction and end the wave ((4) at 167.15. (If you want to learn more about Elliott Wave Theory, please follow this link: Elliott Wave Theory).
Disney Current Daily Chart
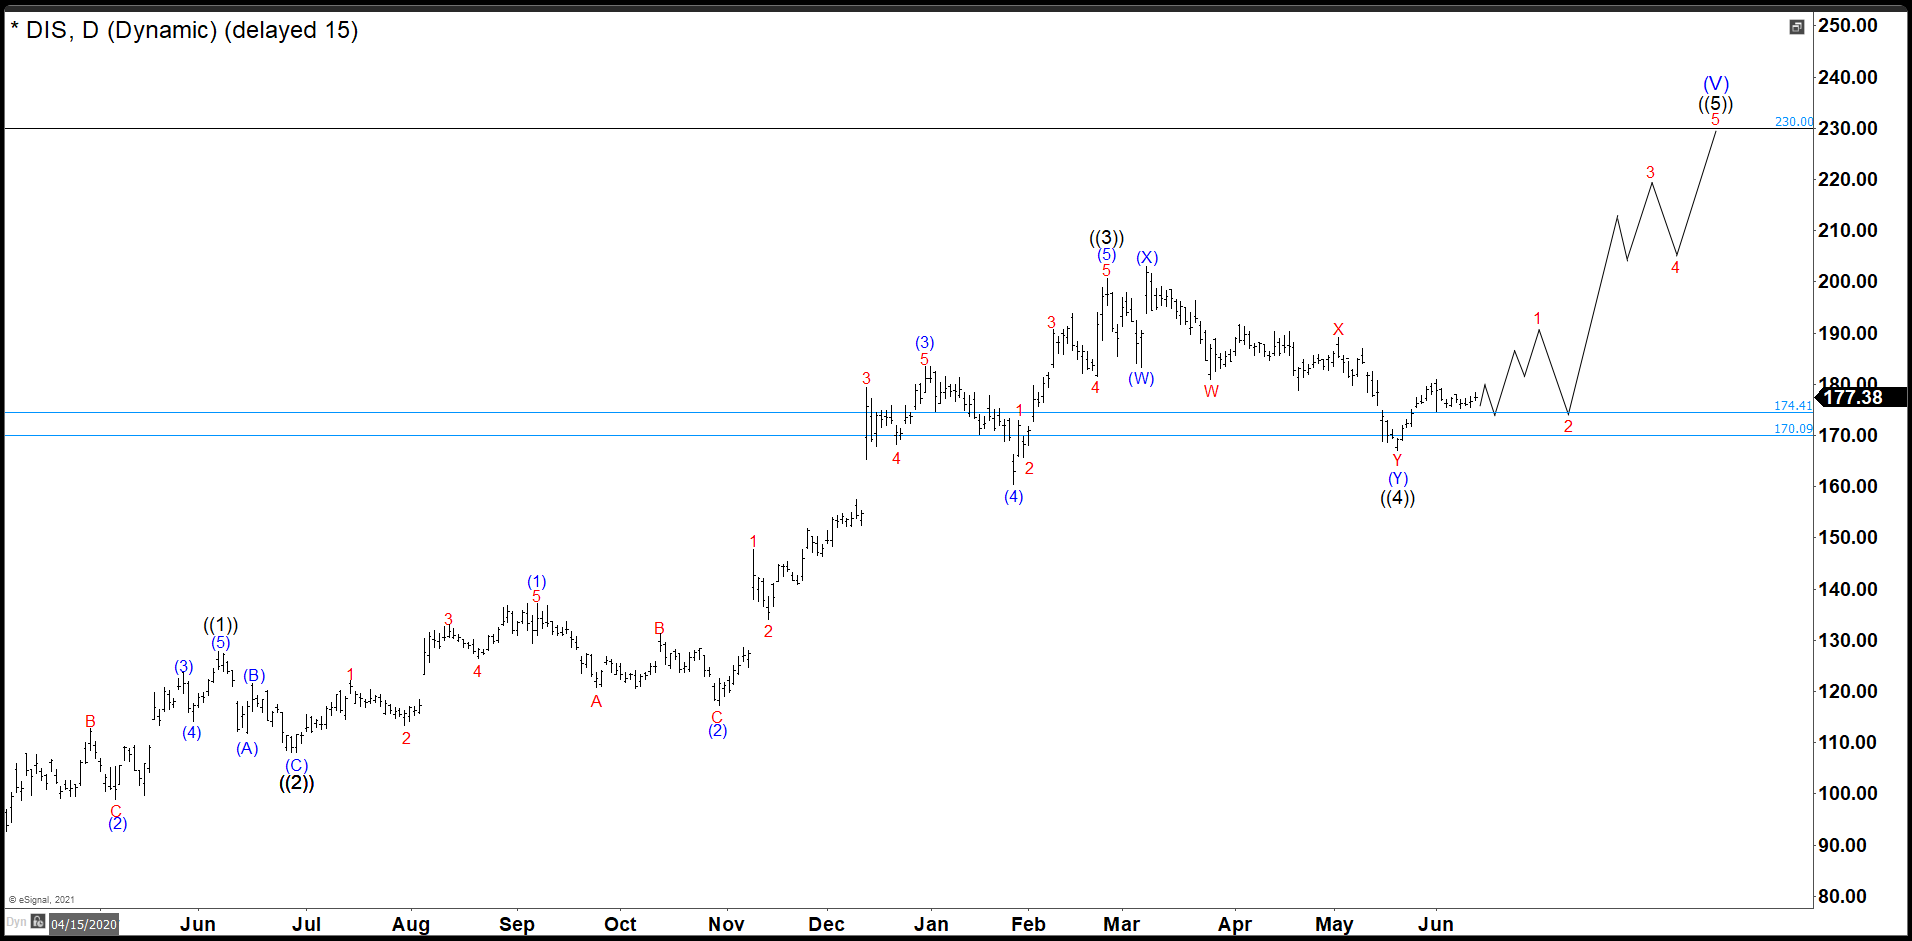
After a month of the Disney’s Q2 earnings results, the stock has rebound, but not enough to be a wave 1 in red. We are looking to reach wave X area in at least 5 swings to consider wave 1 done. Then a pullback is expected before continuing higher. As we stay above 167.15 we are going to push the structure to the upside, technically, Disney should resume the uptrend looking for $230.00 target.
Source: https://elliottwave-forecast.com/stock-market/disney-seems-ended-wave-4/