
Silver Miner ETF (SIL) has been consolidating for 10 months. In the next few months, the ETF may start the next major breakout to the upside The key areas remain to be around $52. A break and close above this level could start the next major bullish rally. The ETF still remains to be one of the best Silver plays if one believes in the bullish thesis. The share price of these publicly traded mining companies usually climb faster than the underlying metals. We analyzed the Elliott Wave Chart of SIL below in Monthly and Daily time frames.
$SIL Monthly Elliott Wave Chart
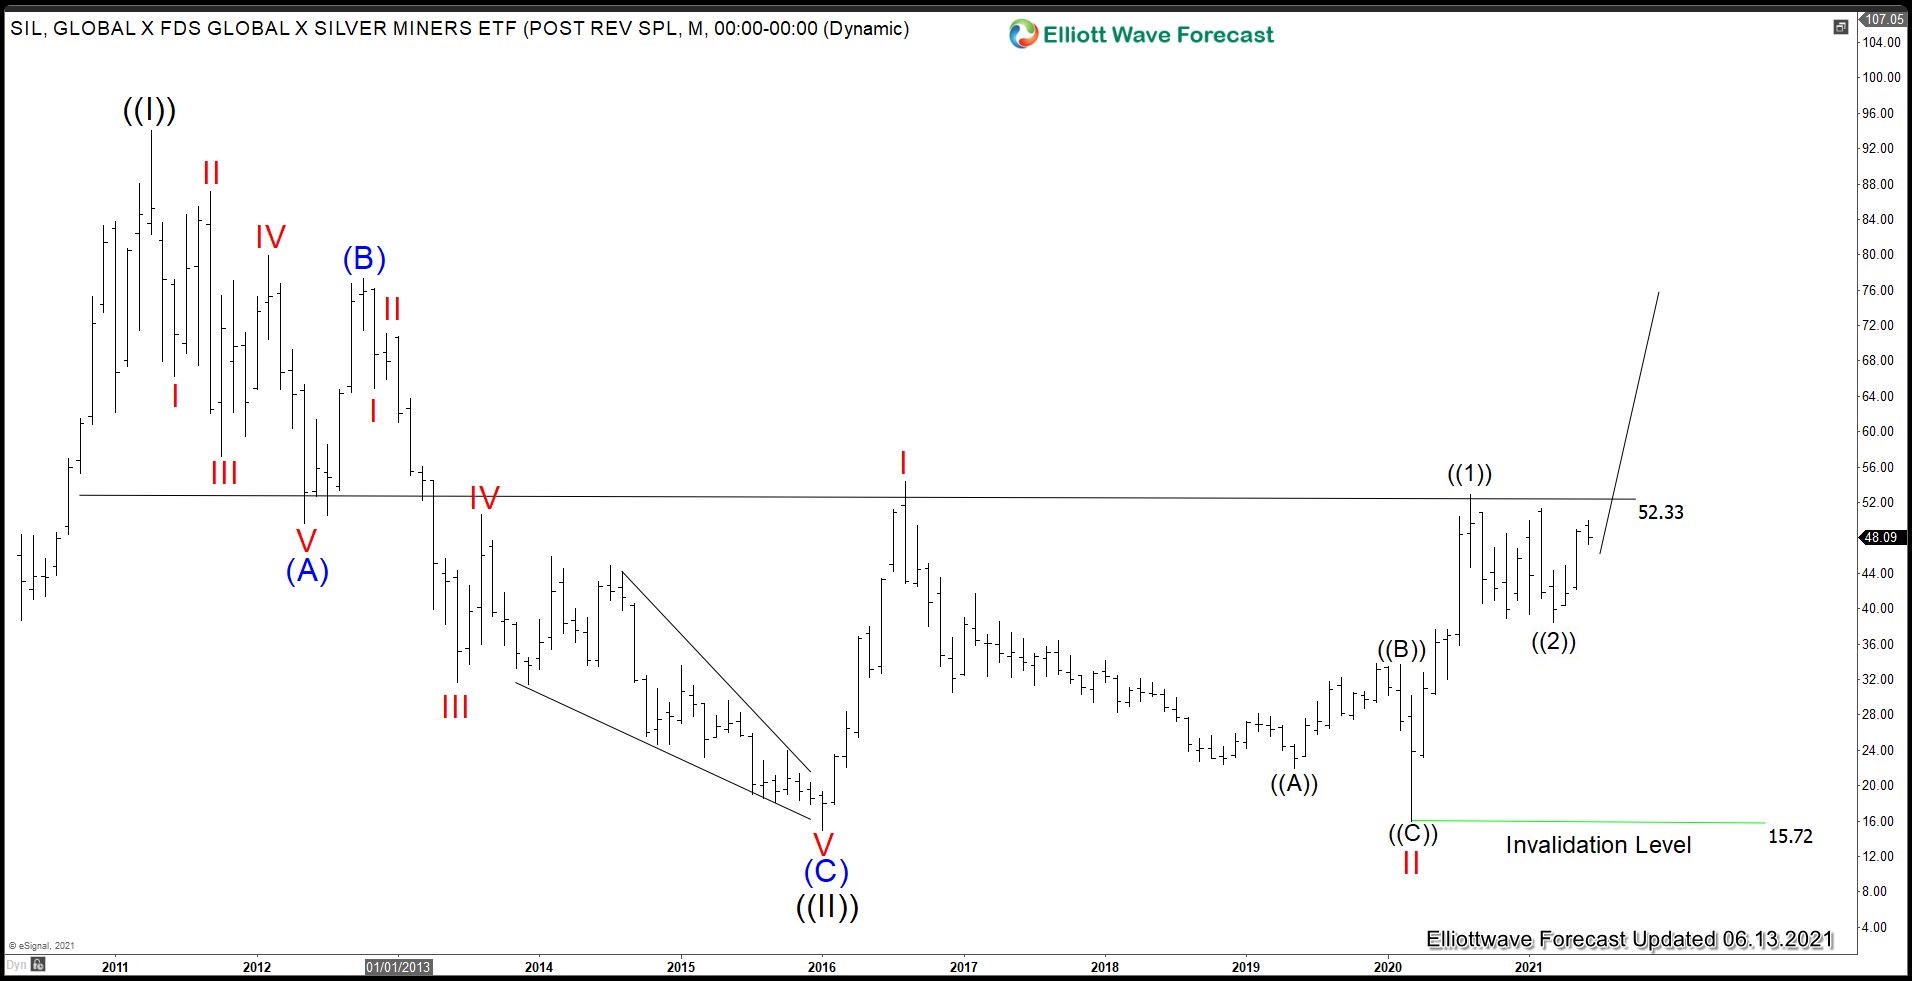
Monthly chart of SIL above shows a clear key area around $52. The structure from 2016 low shows a potential of long term basing pattern. We are calling the rally to August 2020 peak at 52.87 as wave ((1)). The 7 months correction is proposed complete at 38.38 as wave ((2)). In the next few months, the ETF has a chance to attack and break above the key $52 areas to start the next major leg higher.
$SIL Daily Elliott Wave Chart
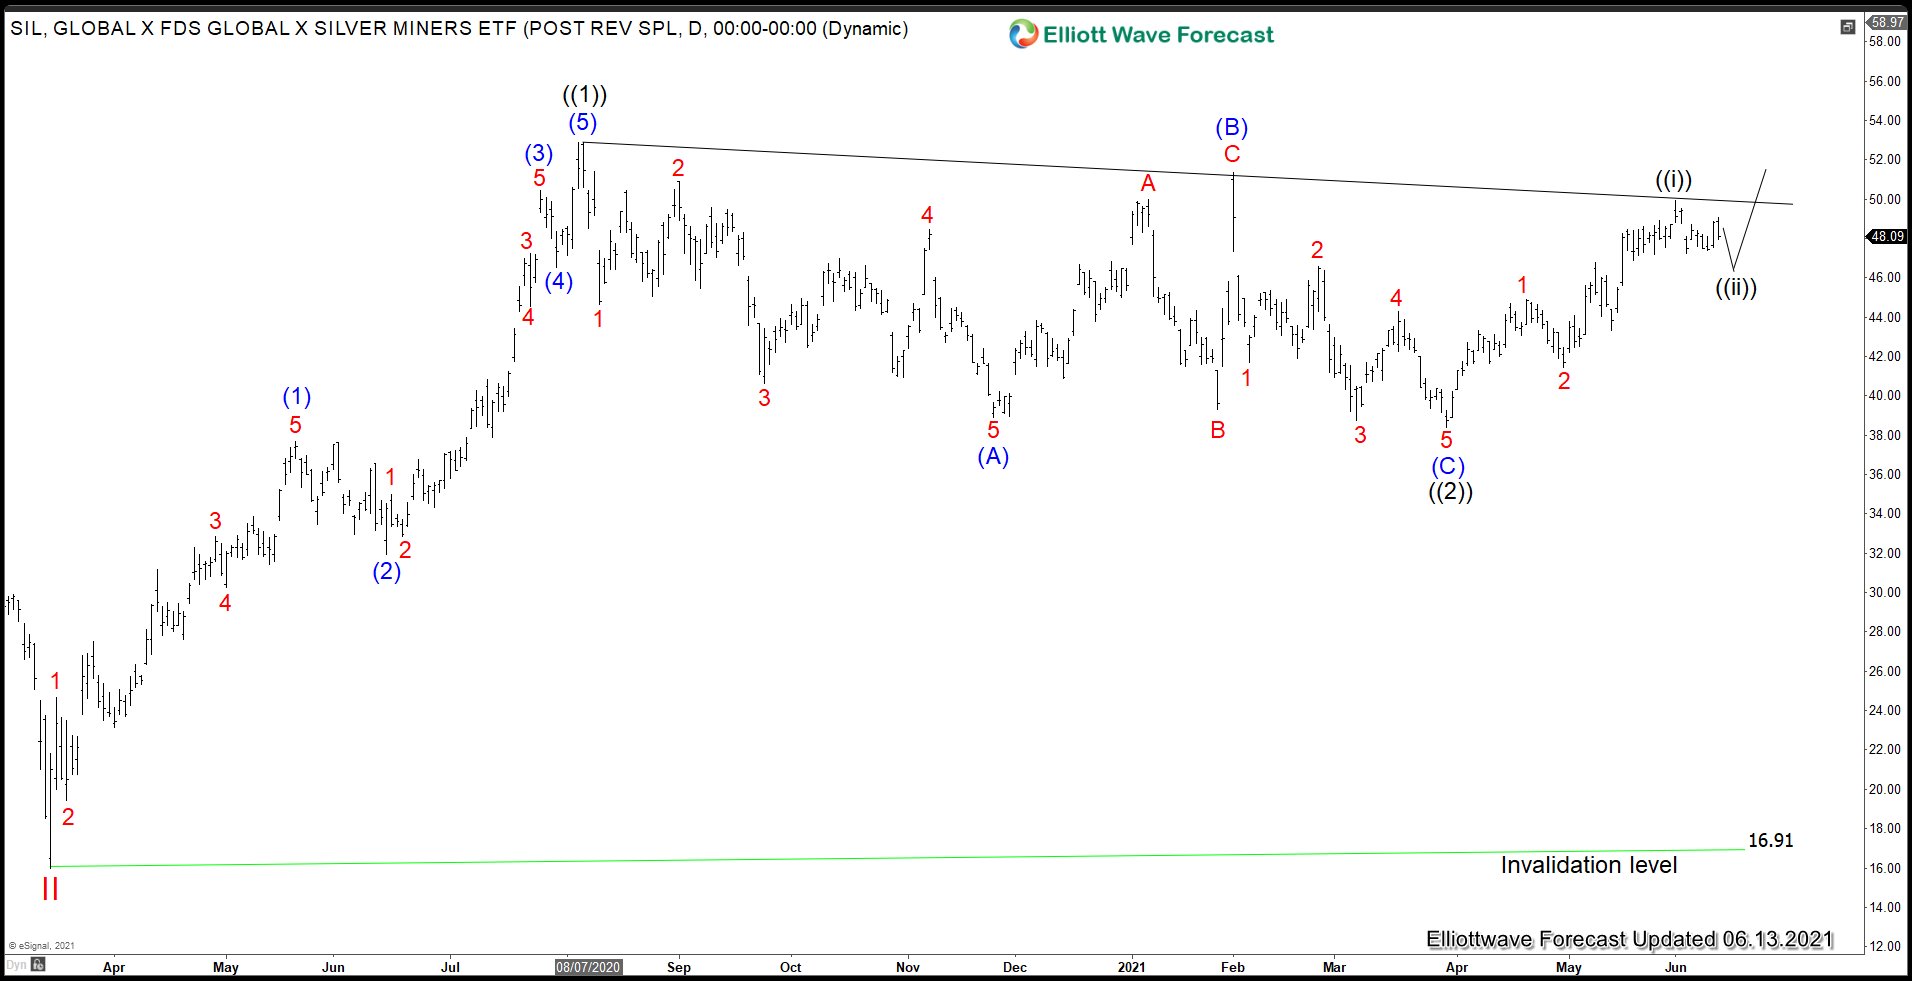
The rally from wave II low on March 1 unfolded as an impulse Elliott Wave structure. The rally ended wave ((1)) at $52.87 and Wave ((2)) pullback ended at 38.38. The ETF has started to turn higher within wave ((3)), but it still needs to break above wave ((1)) at $52.87 to rule out a double correction. Near term, as far as dips stay above 38.38 low, expect the ETF to extend higher.
Source: https://elliottwave-forecast.com/stock-market/silver-miners-sil-looking-for-a-breakout/