In this blog, we take a look at IBEX short term view.
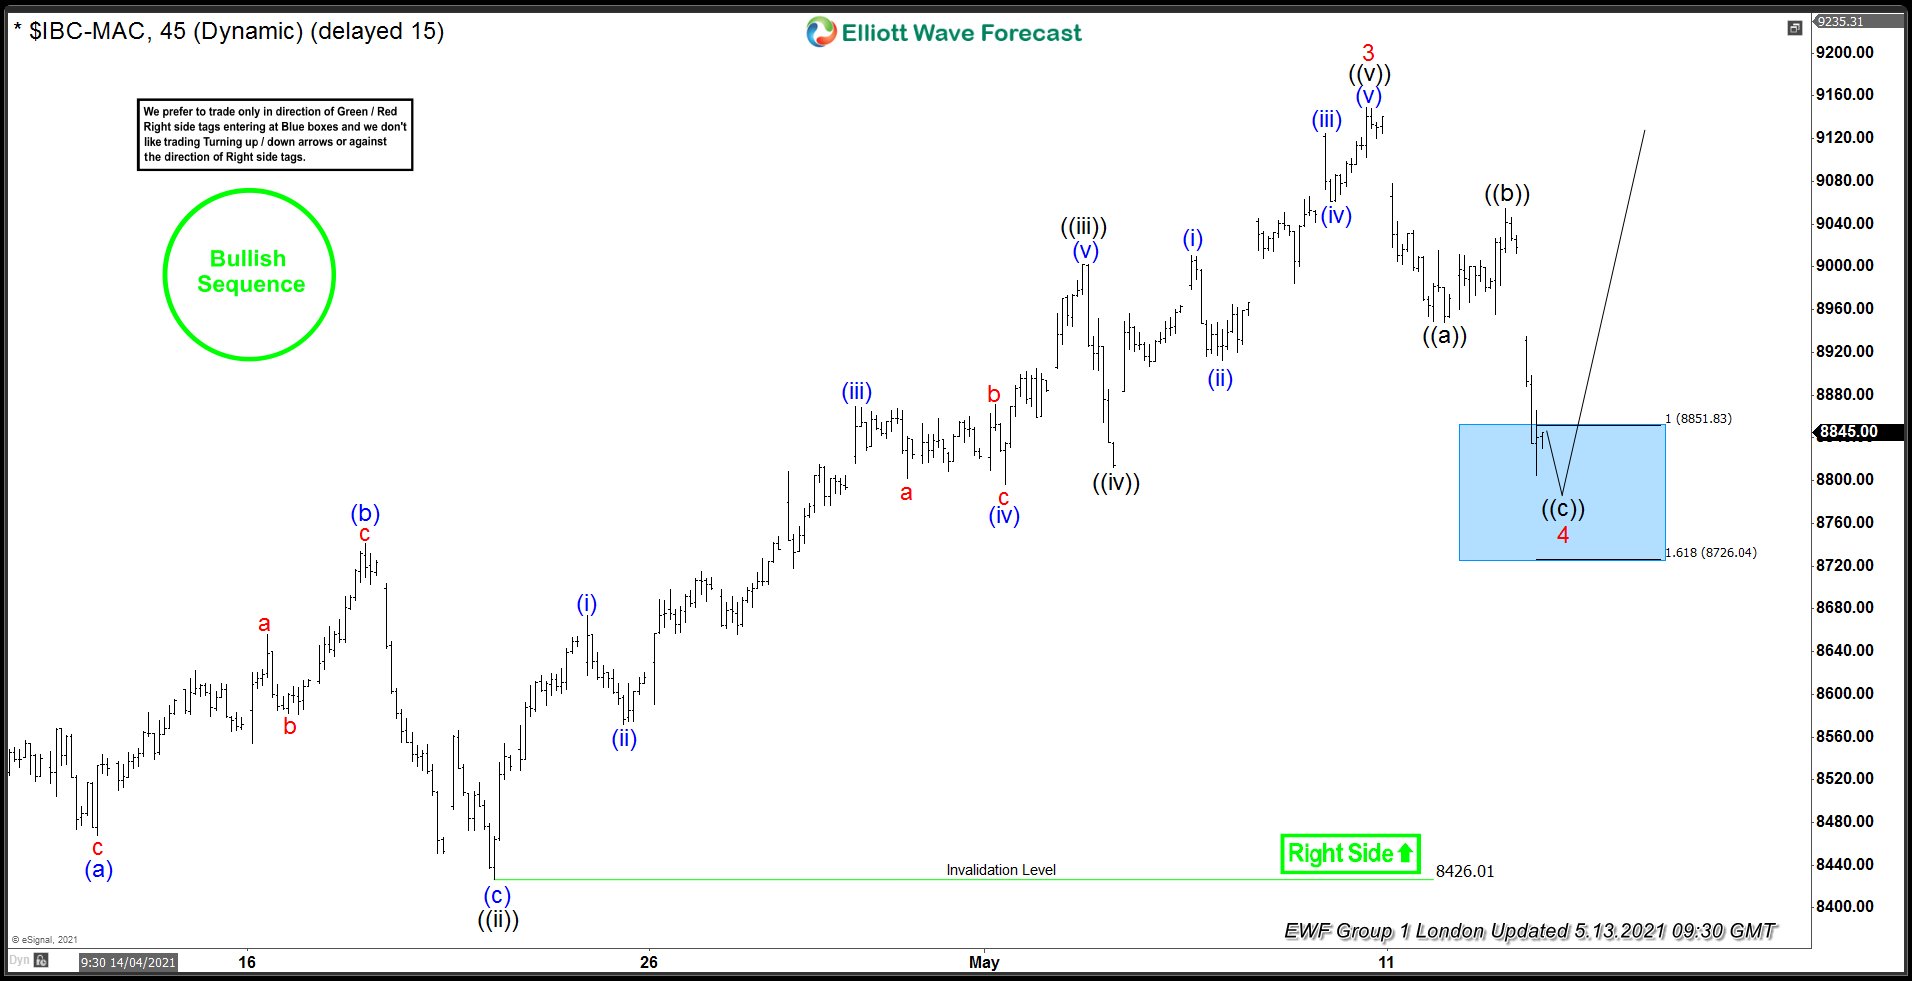
From the 1 hour chart below, IBEX completed a bullish cycle at around $9135 area for red wave 3. Up from black wave ((ii)) lows at $8426.01 , we see an advance in five swings as an impulse. The impulse completed black wave ((iii)), Naturally, a pullback lower in black wave ((iv)) followed. This pullback unfolded as an expanding flat correction denoted a-b-c in red. Pursuant to the correction in black wave ((iv)), we saw another five swings higher, labelled blue (i)-(v); in black wave ((v)) . This completed red wave 3.
Down from red wave 3 peak, we saw a decline lower into the blue box. The decline subdivided into black waves ((a))-((b))-((c)) zig zag. Thus, completing red wave 4 in the blue box area. Although not shown, black waves ((a)) and ((c)) would subdivide into lower degree (i)-(v), each as an impulse wave, as per Elliottwave theory. Black wave ((b)) would serve as a connector. The right side was upside against $8426.01 lows. We also had a bullish sequence. Therefore, we preferred the long side from the blue box area.
Elliottwave 1 Hour Chart From 5/13/2021
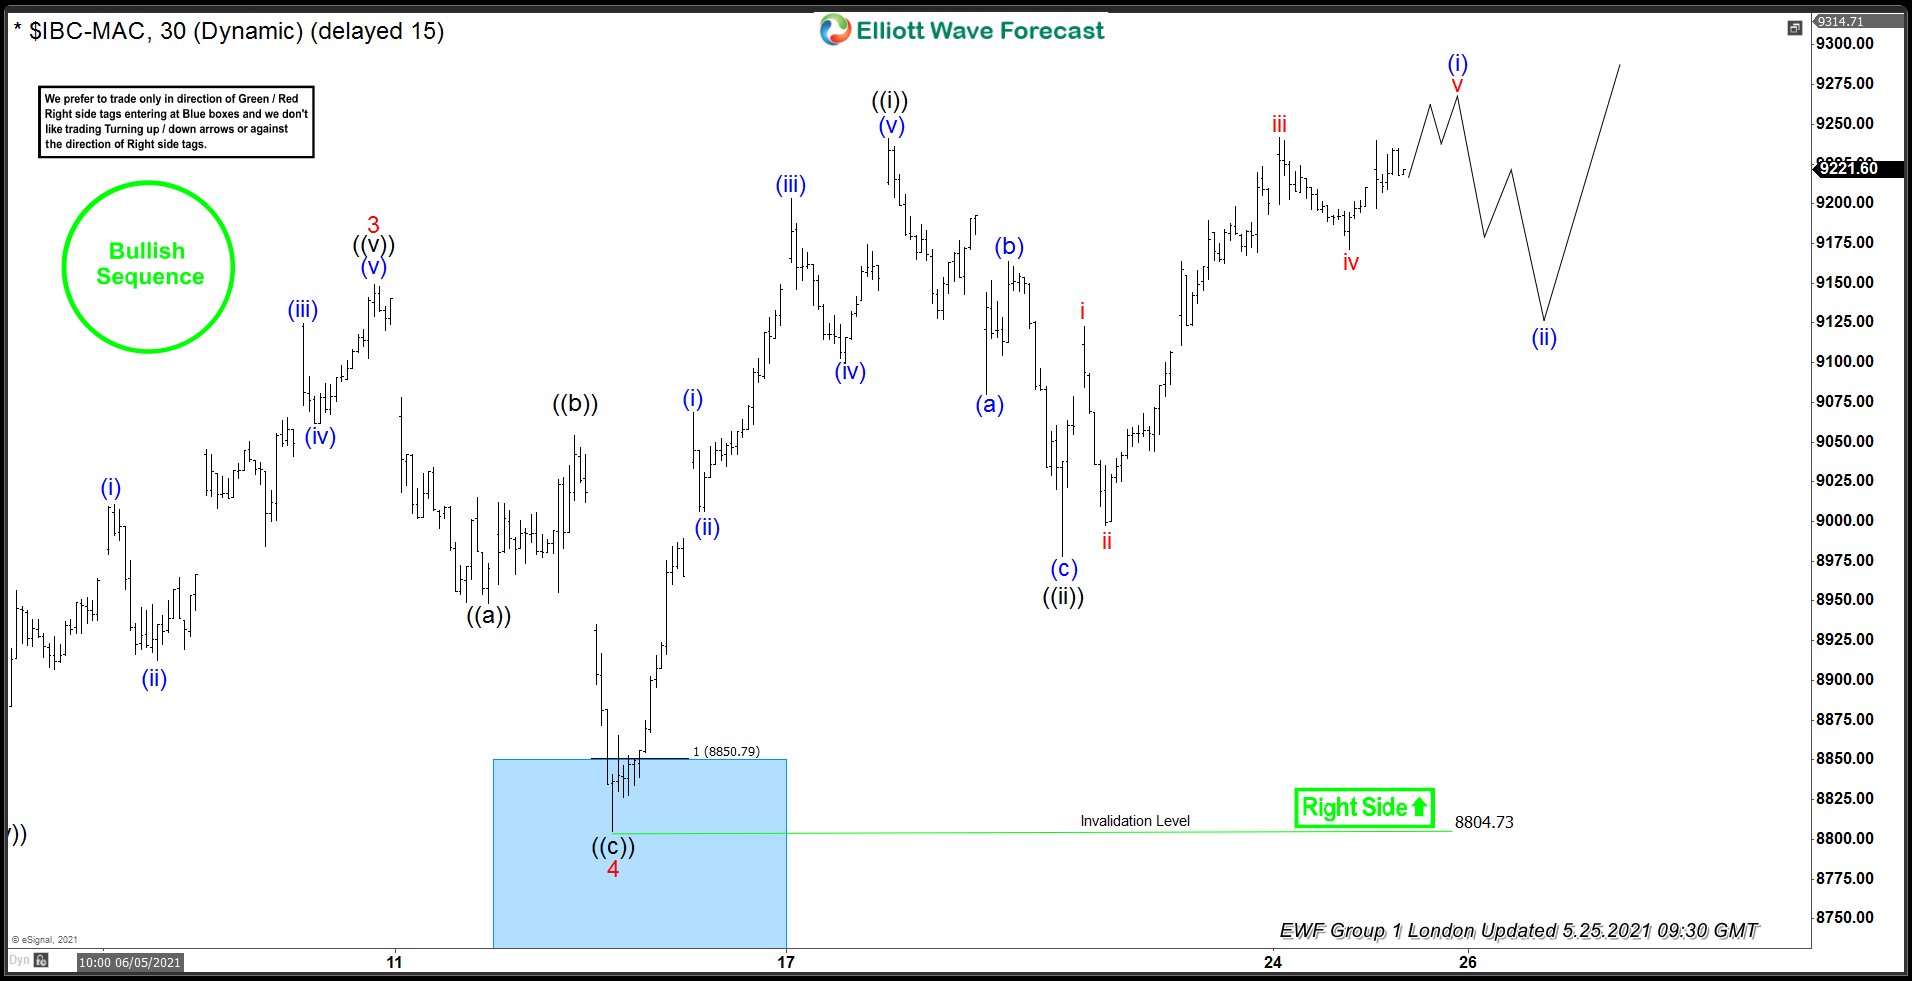
The one hour chart from shows a sharp reaction higher from the blue box. Long positions from the blue box were already running risk free as at 5/17 during the London update. We proposed black wave ((i)) already completed. Inherently, we expected a pullback lower in black wave ((ii)), before more upside could resume. However, the anticipated pullback lower in black wave ((ii)) should find support above $8804.10 low, before turning higher in ((iii)).
Elliottwave 1 Hour Chart From 5/17/2021
Indeed, the recent 1 hour chart from 5/25/2021 shows a pullback lower in ((ii)) as expected. Furthermore, the pullback found support above $8804.10 lows. We see the index advancing further higher, and we expect it to continue towards $9410.70 equal leg area at least, before pulling back for more short term upside. We do not prefer or propose selling any of the anticipated pullbacks, as the right side remains upside.
Elliottwave 1 Hour Chart From 5/25/2021
Source: https://elliottwave-forecast.com/stock-market/buying-dips-blue-box-ibex/