
Hello fellow traders. Another instrument that we have been trading recently is Facebook from Group 3 . As our members know, Facebook is showing bullish impulsive sequences within the cycle from the January 244.5 low, calling for further rally. Consequently we expected the Stock to find buyers in 3 ,7,11 swings. Recently we got pull back that unfolded as Elliott Wave Zig Zag pattern. In the further text we are going to explain the Elliott Wave Pattern and the trading strategy.
Before we take a look at the real market example, let’s explain Elliott Wave Zigzag pattern.
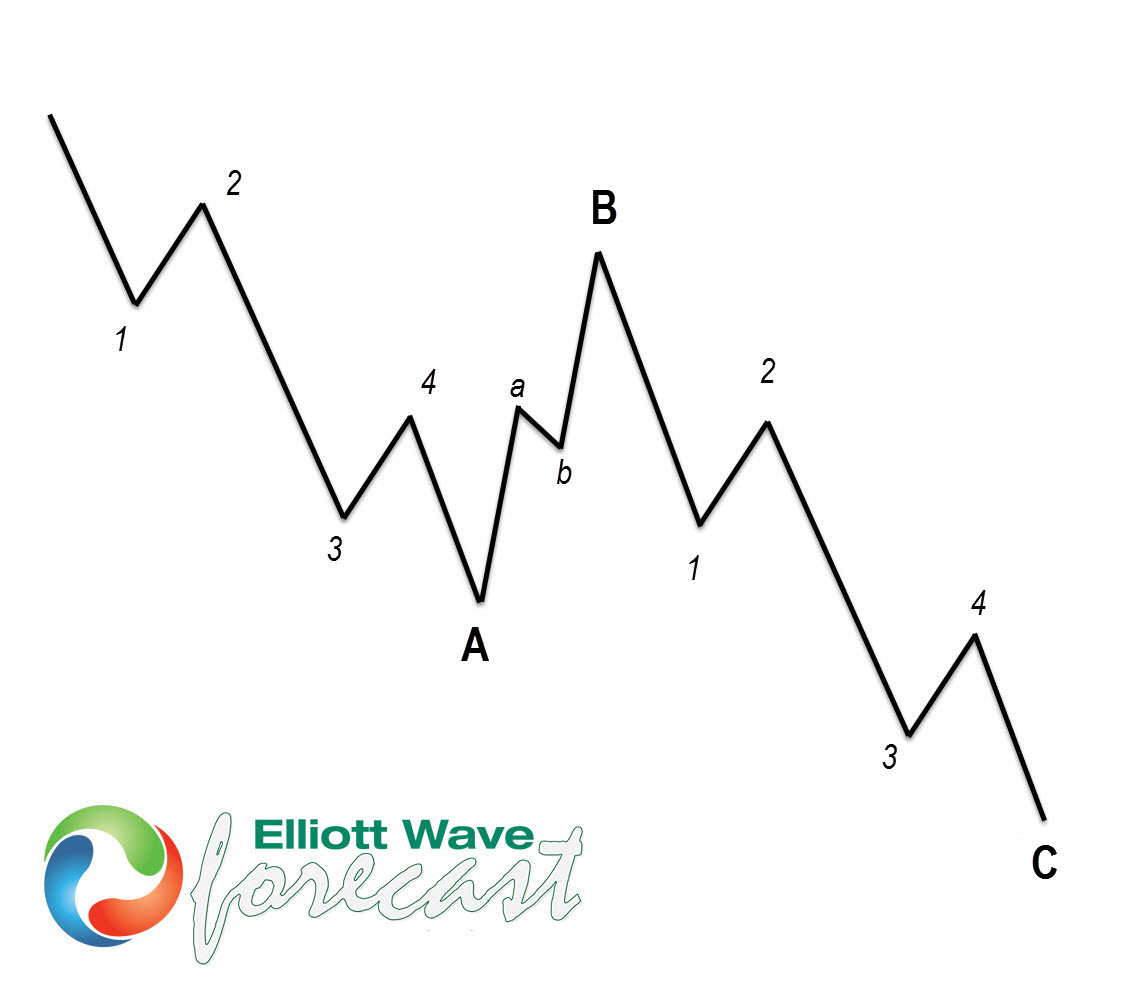
Elliott Wave Zigzag is the most popular corrective pattern in Elliott Wave theory . It’s made of 3 swings which have 5-3-5 inner structure. Inner swings are labeled as A,B,C where A =5 waves, B=3 waves and C=5 waves. That means A and C can be either impulsive waves or diagonals. (Leading Diagonal in case of wave A or Ending in case of wave C) . Waves A and C must meet all conditions of being 5 wave structure, such as: having RSI divergency between wave subdivisions, ideal Fibonacci extensions and ideal retracements.
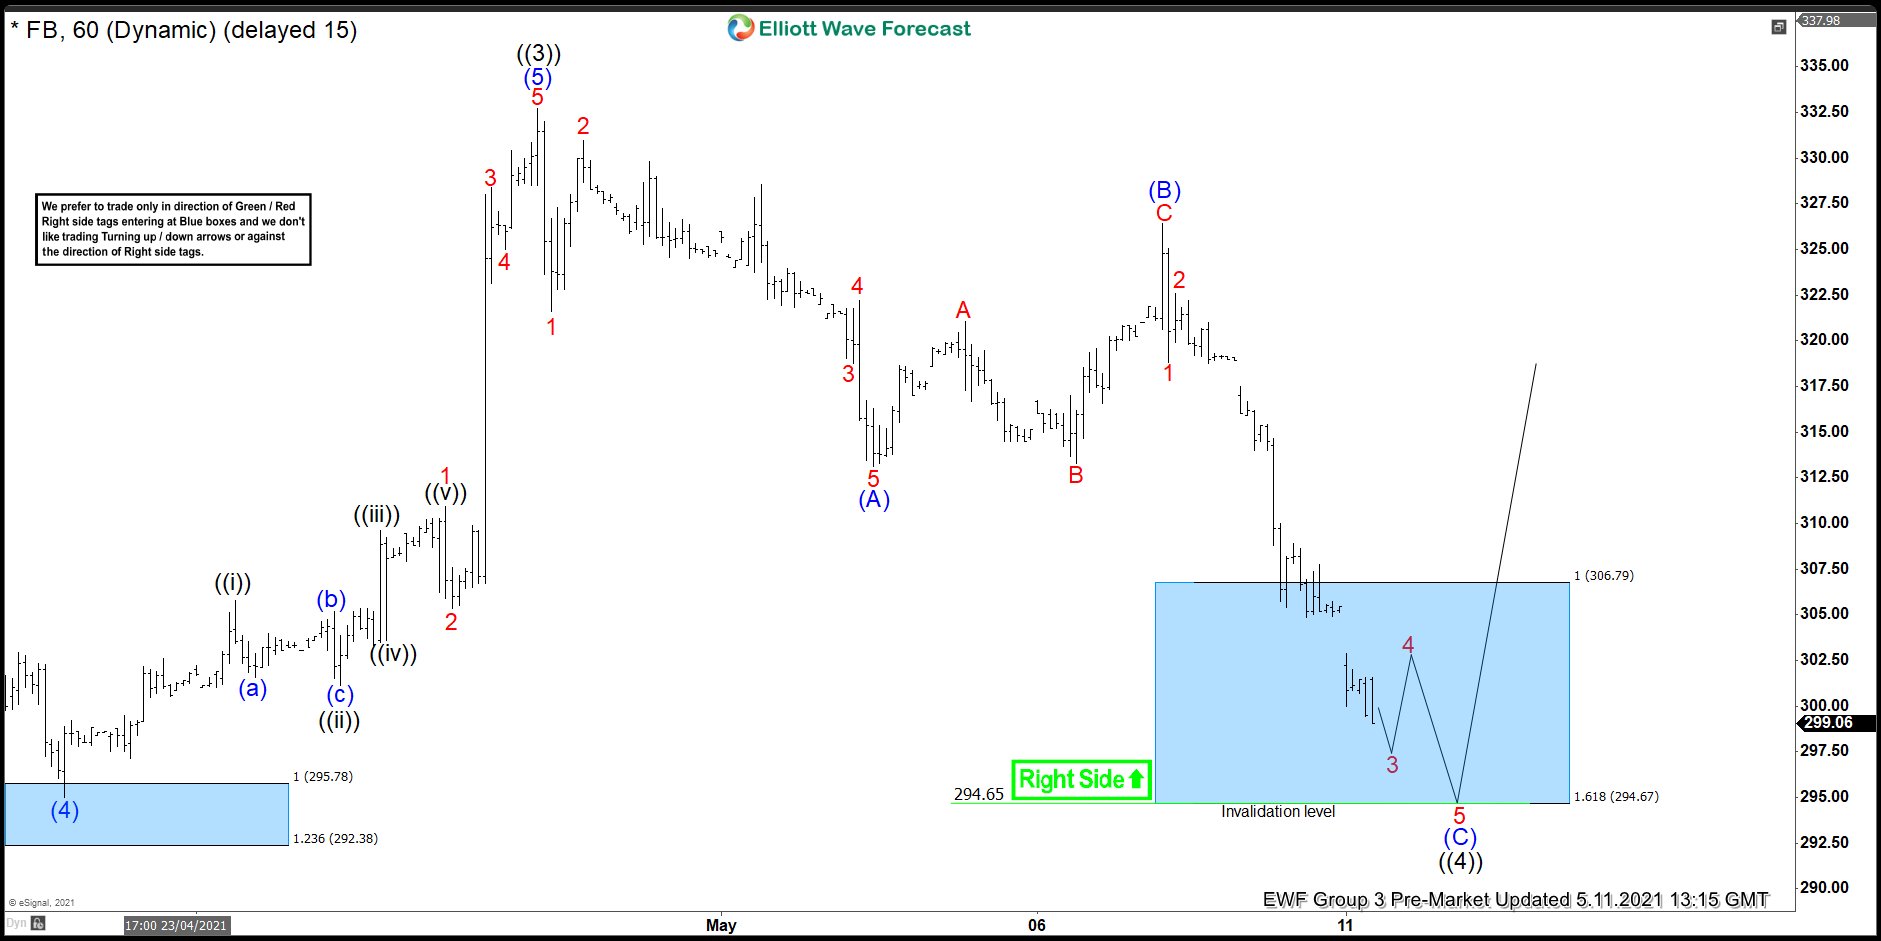
Facebook Elliott Wave Analysis 05.11.2021
$FB is doing wave ((4)) pull back that is having form of Elliott Wave Zig Zag pattern. First leg (A) blue unfolded as 5 waves down from the peak. Then we got 3 wave bounces in wave (b) and finally, we’re doing last leg down (c) black. Pull back has reached extreme zone at 306.79-294.67 ( buyers area) and can complete any moment. We don’t recommend selling it and favor the long side from the mentioned zone. As the main trend is bullish we expect buyers to appear for 3 waves bounce at least. As soon as the price reaches 50 Fibs against the (B) blue peak, we will make long positions risk free. In worst case if 1.618 fib ext level gets broken ( 294.67) we will be stopped out. Blue Boxes are no enemy areas , giving us 85% chance to get a bounce.
You can learn more about Elliott Wave Zig Zag Patterns at our Free Elliott Wave Educational Web Page.
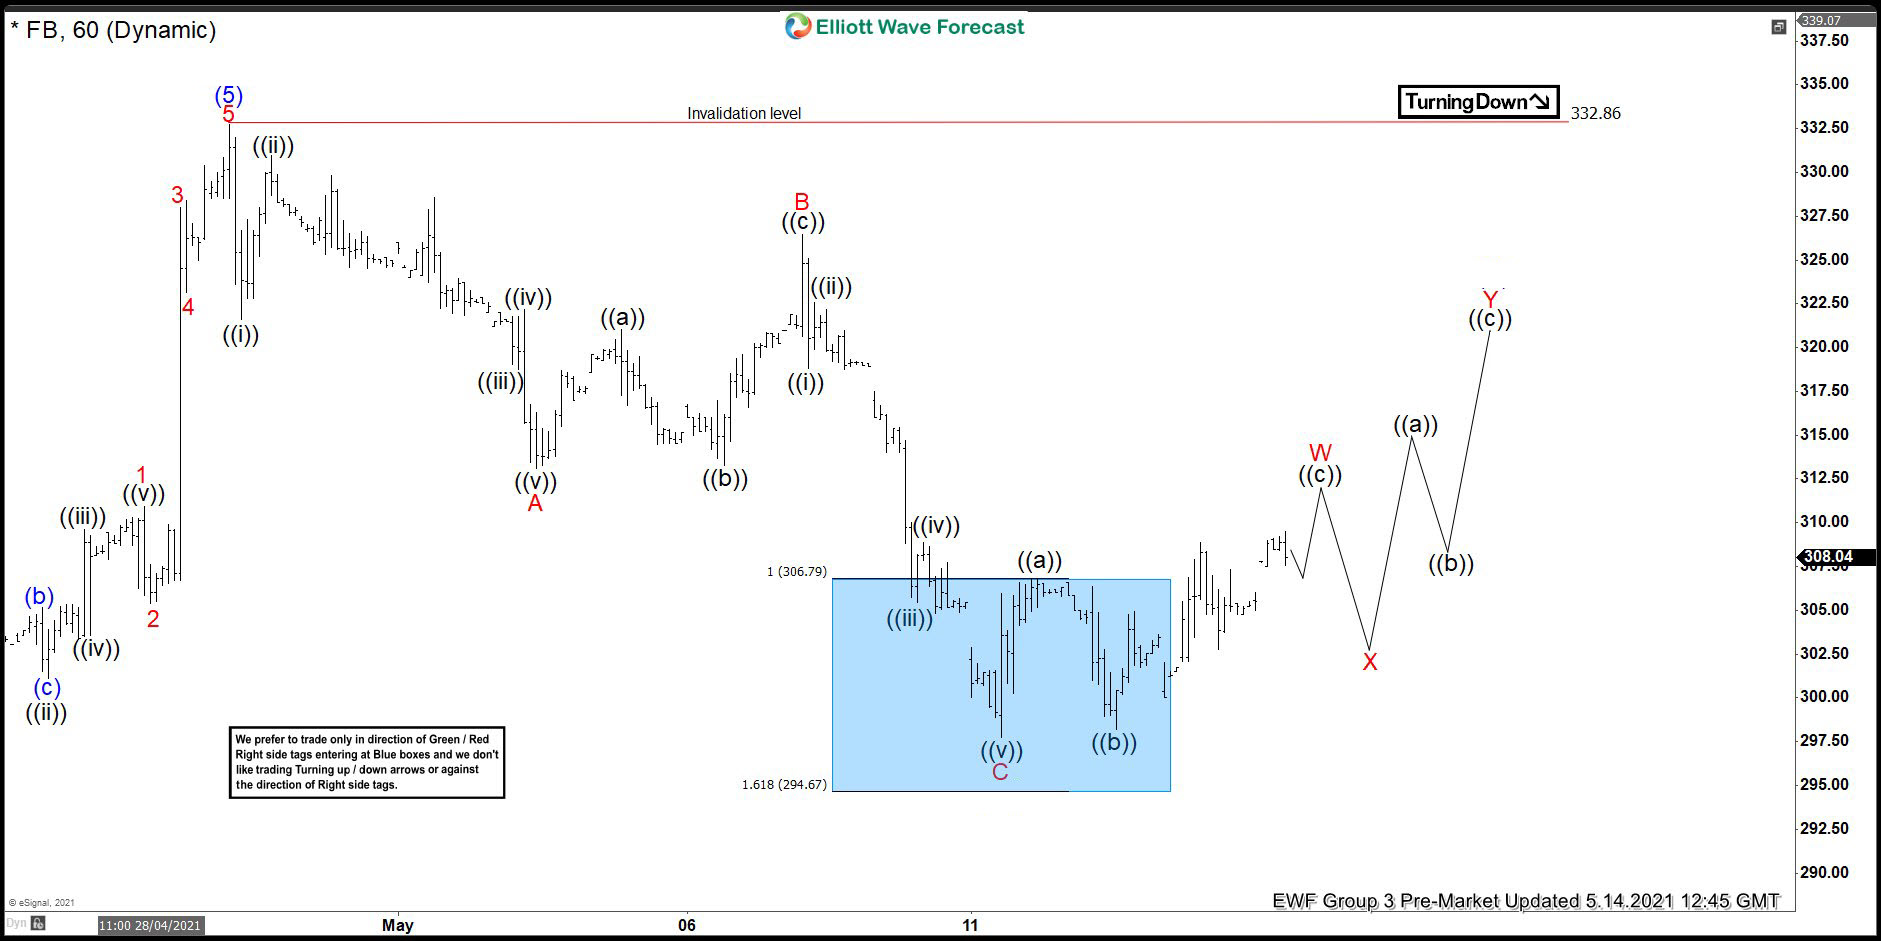
Facebook Elliott Wave Analysis 05.14.2021
Buyers appeared at the blue box- buying zone and we are getting reaction. Bounce is still shallow at the moment but we believe the stock ended 3 waves down from the peak. We would like to see further separation from the current low. As soon as the price reaches 50 fibs against the B red we will make long positions from the blue box risk free.
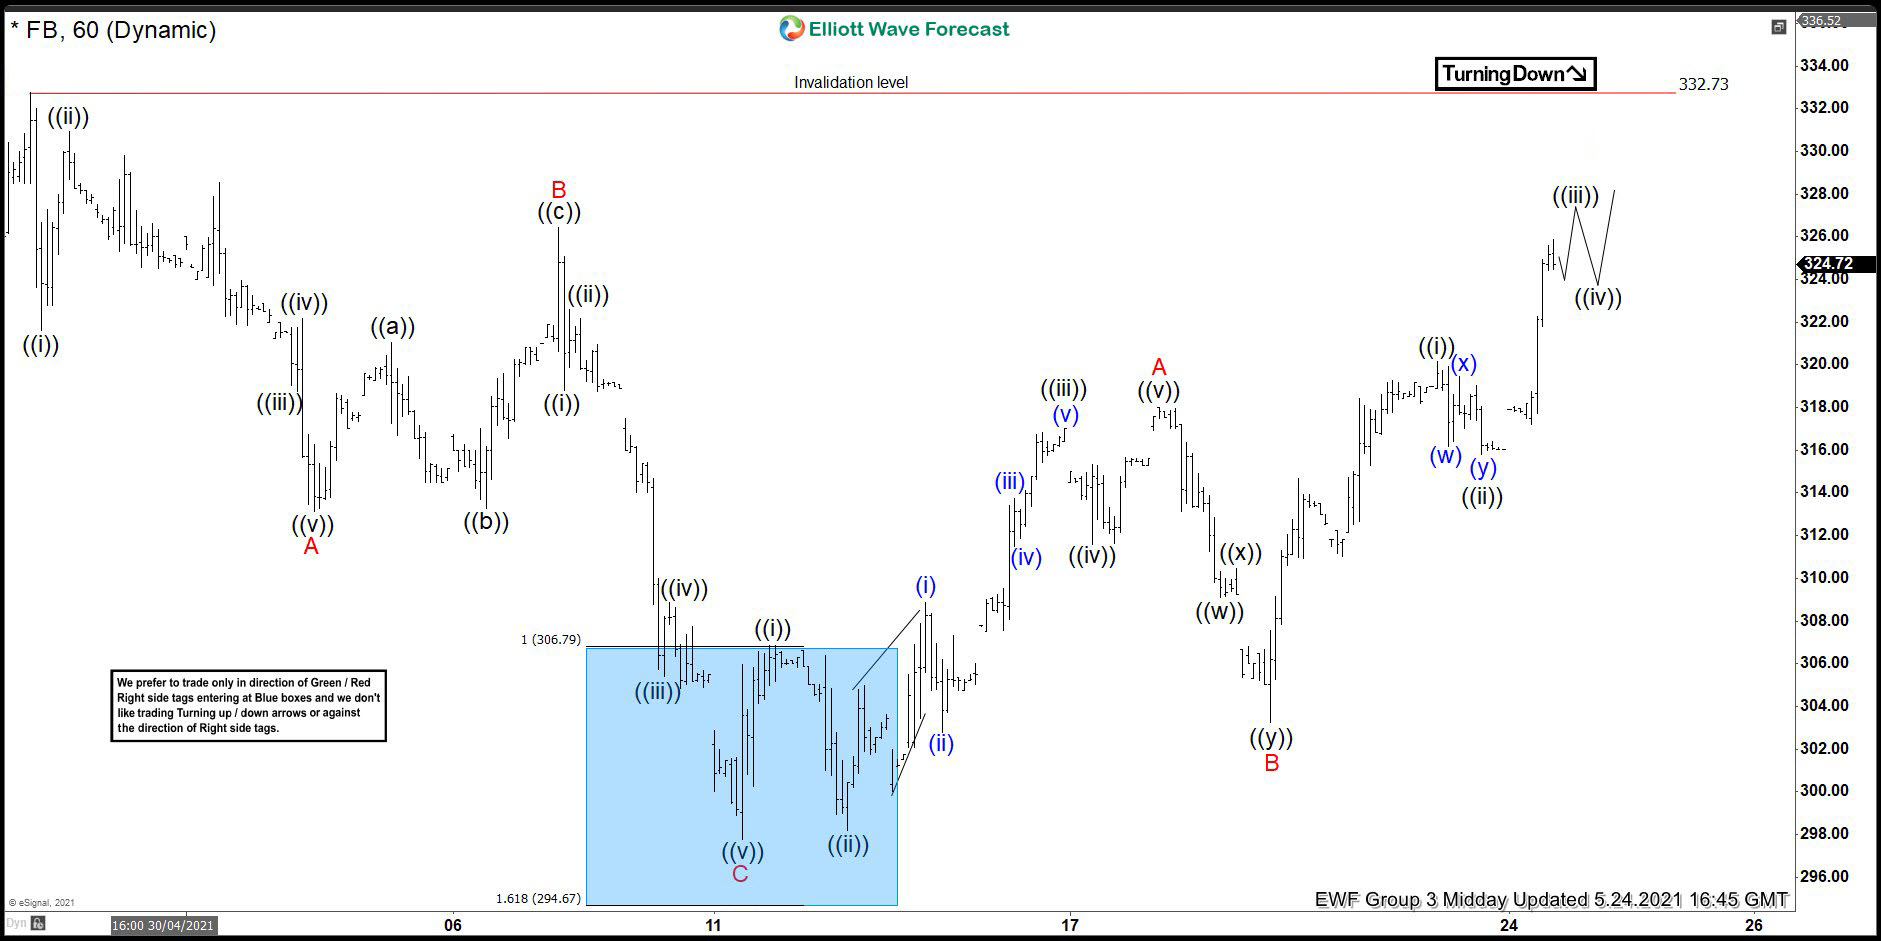
Facebook Elliott Wave Analysis 05.24.2021
We got further separation from the lows as expected. Members who took long trades are now enjoying profits in a risk free positions. Cycle from the May 12th low looks like corrective 3 wave sequences. Break of 332.7 peak would suggests next leg up is already in progress, otherwise as far as the price stays below that level, 7 swings in the deeper pull back cannot be ruled out.
Keep in mind market is dynamic and presented view could have changed in the mean time. You can check most recent charts in the membership area of the site. Best instruments to trade are those having incomplete bullish or bearish swings sequences.We put them in Sequence Report and best among them are shown in the Live Trading Room.
Elliott Wave Forecast