
In this technical blog we’re going to take a quick look at the Elliott Wave charts of XLP ETF published in members area of the Elliottwave-Forecast . As our members know, XLP is showing impulsive bullish sequences in the cycle from the March 2020 (47.65) low. Recently we got short term pull back that has unfolded as Elliott Wave Double Three pattern that has given us opportunity to enter long trades. In further text we’re going to explain the forecast and Elliott Wave Pattern and trading strategy.
Before we take a look at the real market example, let’s explain Elliott Wave Double Three pattern.
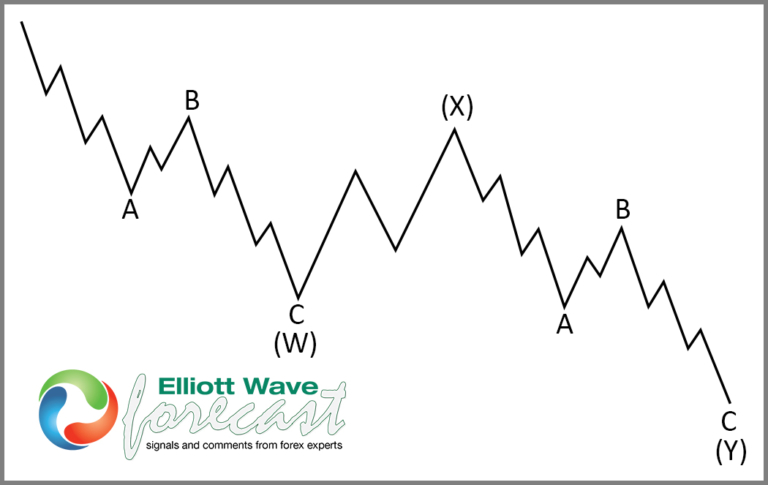
Elliott Wave Double Three Pattern
Double three is the common pattern in the market these days, also known as 7 swing structure. It’s a reliable pattern which is giving us good trading entries with clearly defined invalidation levels and target areas.
The picture below presents what Elliott Wave Double Three pattern looks like. It has (W),(X),(Y) labeling and 3,3,3 inner structure, which means all of these 3 legs are corrective sequences. Each (W) and (Y) are made of 3 swings , they’re having A,B,C structure in lower degree, or alternatively they could have W,X,Y labeling.
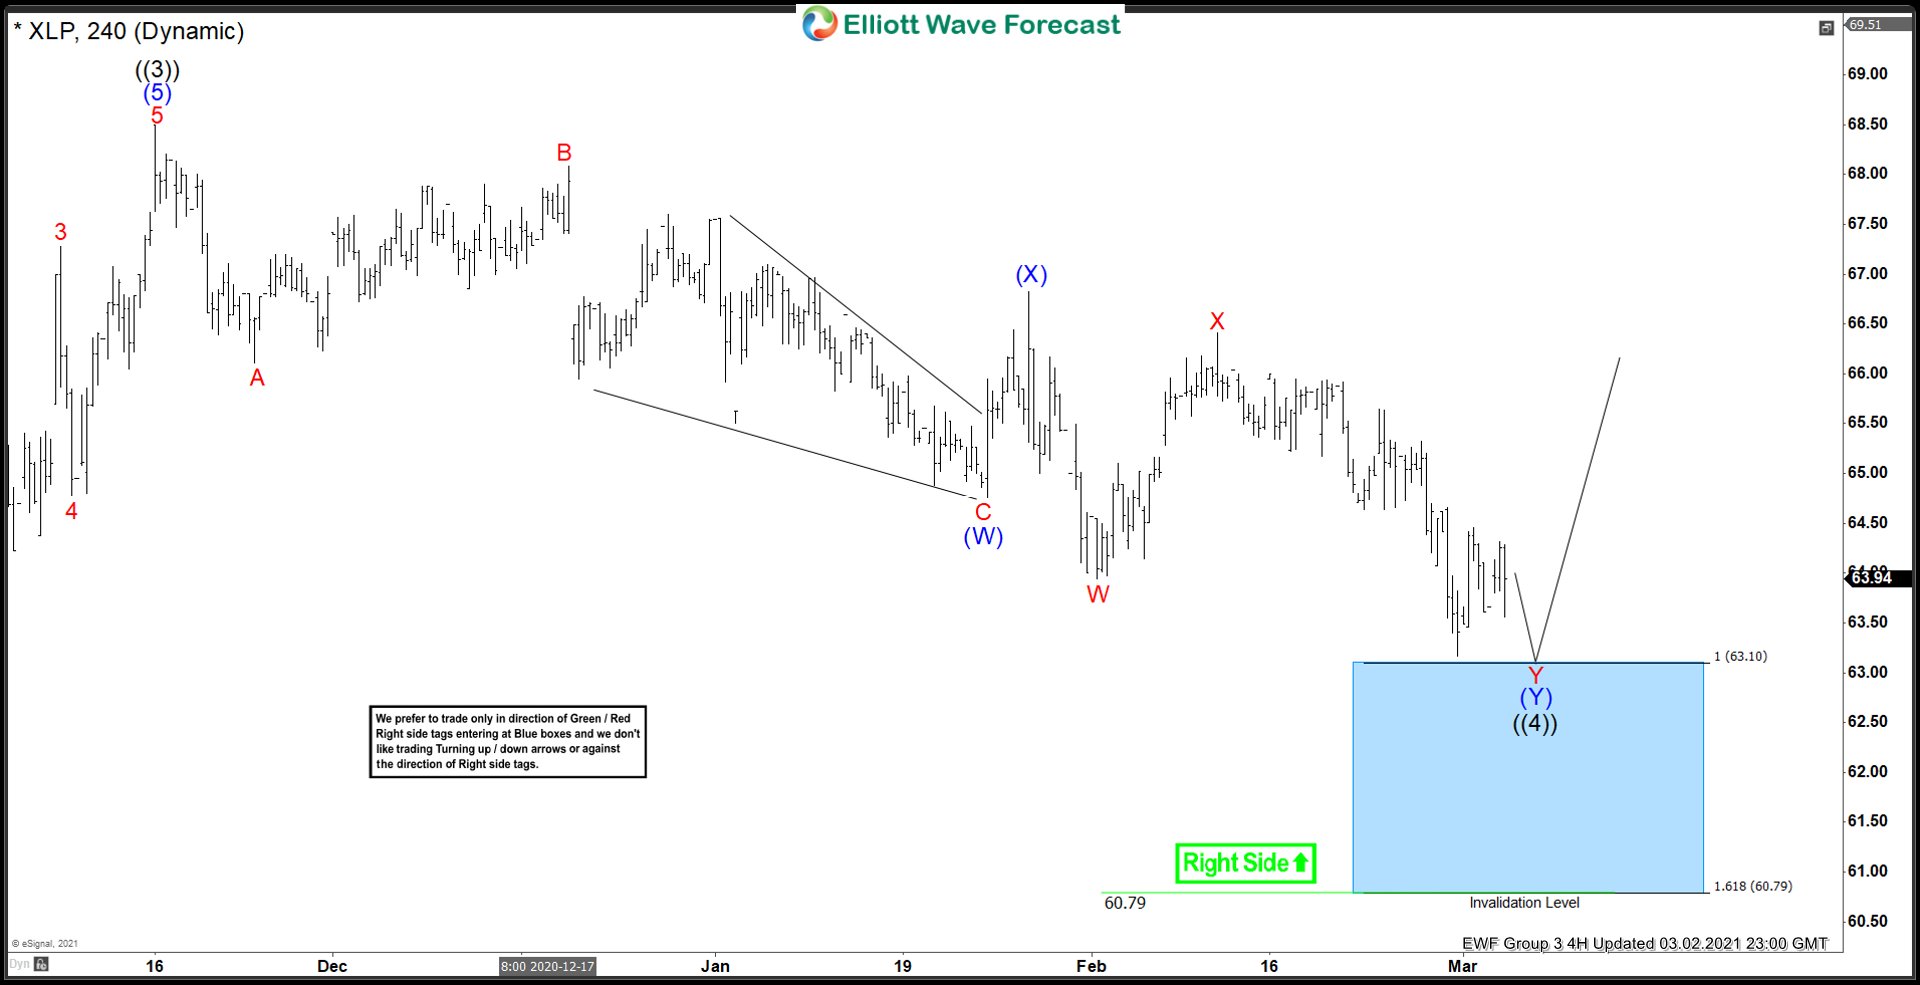
XLP 4 Hour Elliott Wave Analysis 3.02.2021
Current view suggests pull back ((4)) black is unfolding as Elliott Wave double three pattern with inner labeling: (W)(X)(Y) blue. As we can see on the chart below each leg has corrective sequences. The price has slightly missed equal legs at 63.1. We believe another marginal push down can be seen toward blue box area 63.1-60.79. Trading strategy remains buying the dips at the extreme zone, if it gets reached. As the main trend is bullish buyers should appear at the blue box for a 3 waves bounce at least. Once bounce reaches 50 fibs against the middle pivot (X) blue , we should make long positions risk free.
You can learn more about Elliott Wave Double Three Patterns at our Free Elliott Wave Educational Web Page.
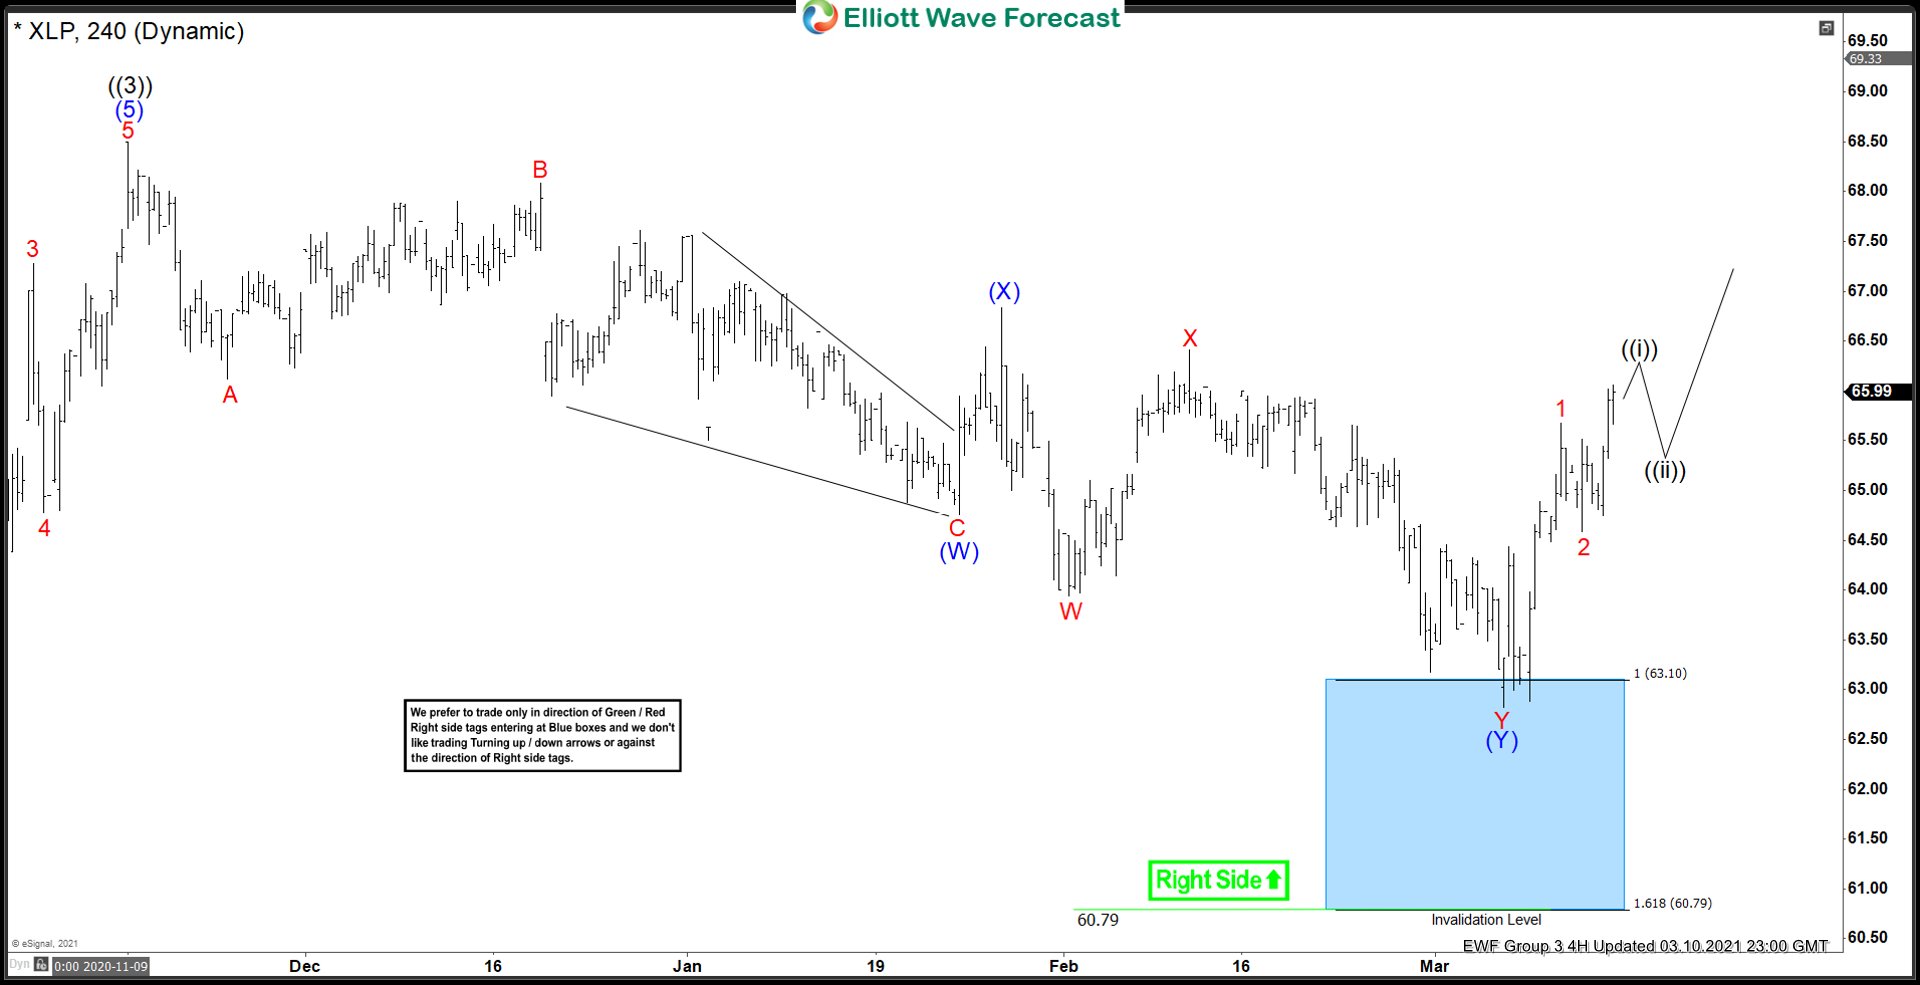
XLP 4 Hour Elliott Wave Analysis 3.10.2021
Eventually XLP made another leg down as we expected. ETF found buyers right at the Blue Box area. Wave ((4)) pull back is completed at the 32.81 low. Bounce already reached and exceeded 50 fibs against the (X) blue pivot. All long positions from the blue box area should be risk free at this stage.
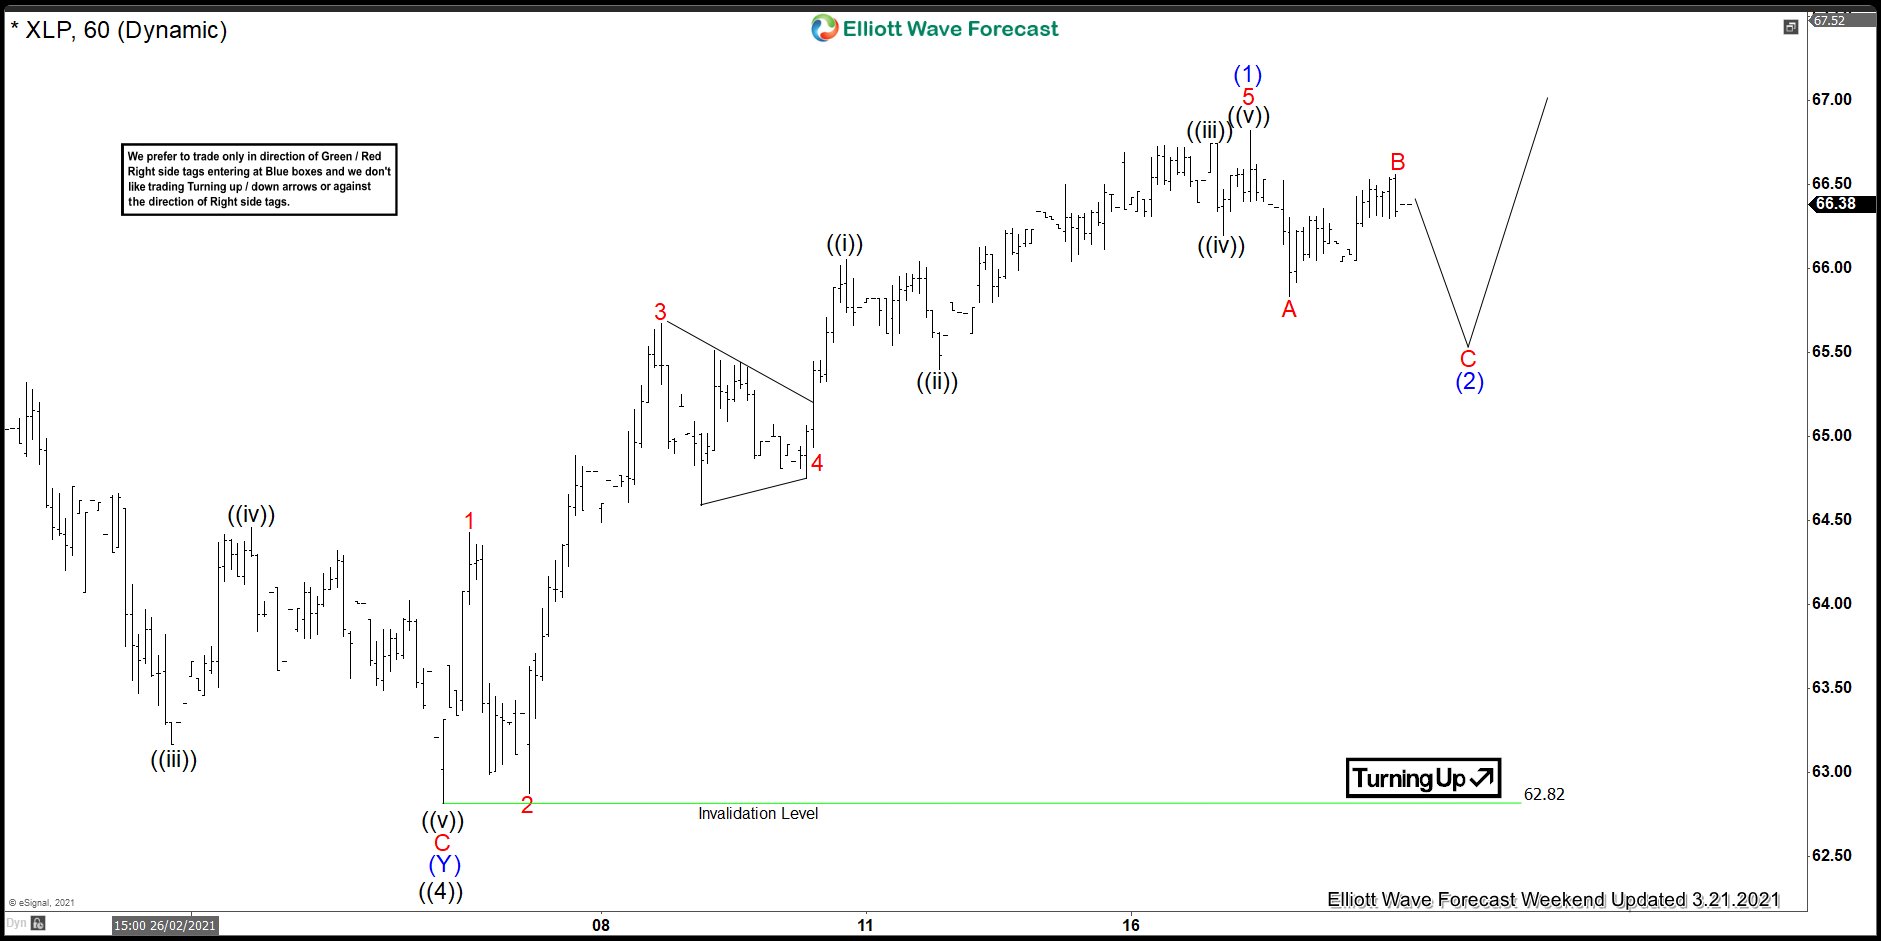
XLP 1 Hour Elliott Wave Analysis 3.21.2021
This is what the price structure looks like in shorter time frame. The price made further separation higher from the 62.82 low. Current view suggests we have ended 5 waves up from the mentioned low, and now correcting that cycle. Pull back looks incomplete at the moment and we still can see another leg down C red of (2) blue.
Keep in mind that market is dynamic and presented view could have changed in the mean time. You can check most recent charts in the membership area of the site. Best instruments to trade are those having incomplete bullish or bearish swings sequences. We put them in Sequence Report and best among them are shown in the Live Trading Room.
Elliott Wave Forecast
Source: https://elliottwave-forecast.com/elliottwave/xlp-buying-elliott-wave-double/