
As we always do at Elliottwave-Forecast, we look at the market as a whole. We track over hundreds of instrument around the world to get a more complete forecast. There is a degree of correlation among different instrument and we have developed a system to identify them. We group together correlated instrument and create different subdivisions.
Many wavers make the mistake of just forecasting a single instrument and not looking at others. The Elliott wave Theory is a great tool but the technique cannot be used only by itself. It requires further refinement. Correlation is a great tool to forecast the market and when it is used the right way, it provides an amazing value. We are going to make a point in this article about why EEM (Emergency Market) can tell wavers something very important about the state of world indices.
The Index shows five swings since the lows at 11.2008 and the idea of five waves into new highs above the peak at 10.2007 opens a bullish sequence since the all-time lows. The Bullish sequence is a warning to sellers because more upside should be happening minimum until it reaches the $72.47-$85.44 area. The extension in EEM, if seen, will support World Indices into much higher levels.
We have mentioned a few times in previous articles about the probability that a nest can happen among World Indices. We did a seminar last year in the middle of the Covid 19 selloff, and we explained the possibility of the nest. Here is the recording of the Seminar. Watch it to understand the possibility of the nest among World Indices. A nest is a sequence of five waves which happens before a huge move happens in the powerful wave 3 of (3). The following chart is an example of a nest in the Elliott Wave Theory:
A Nest Example
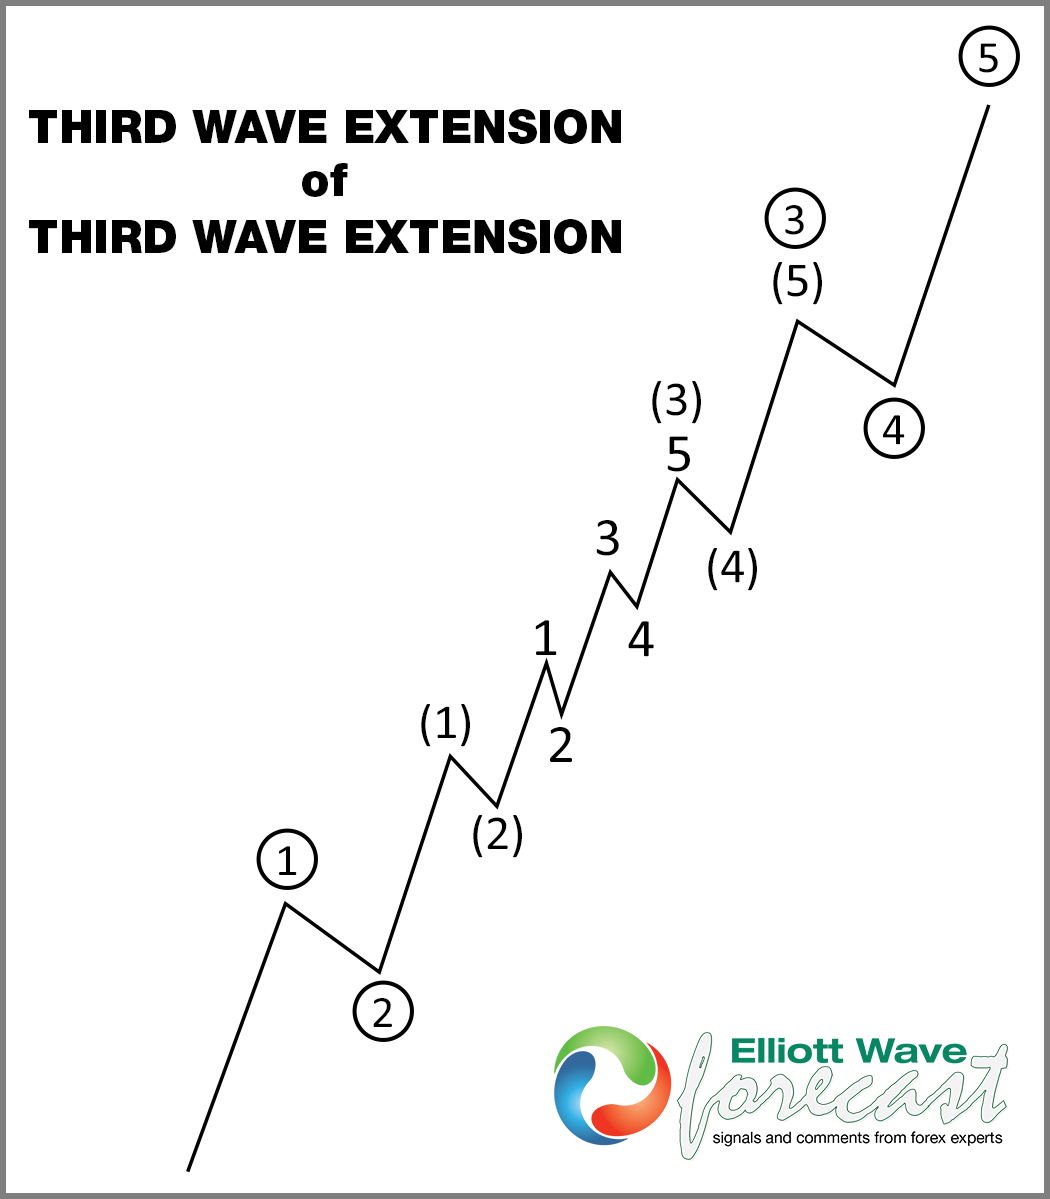
From the chart above, if we look at the start of the move higher, there is a series of five waves in three different degrees before the separation takes place.
Getting back to EEM, we can see from the chart below that since the lows at 11.2008, there are five swings. The third swing however has the shortest length. Since Elliott Wave Theory stipulates wave 3 can not be the shortest wave, that means it’s not a five wave from 11.2008 low. The Index then can be nesting in three different degrees and now into wave ((3)) in a second-degree nest. The idea that EEM is nesting will deny the idea that five waves from all-time lows is happening in world indices and it denies the idea we will soon see a huge decline. The Idea of nesting in EEM makes the scenario we presented in last year’s seminar a real possibility, resulting in unthinkable levels across World Indices.
EEM Monthly Elliott Wave Chart
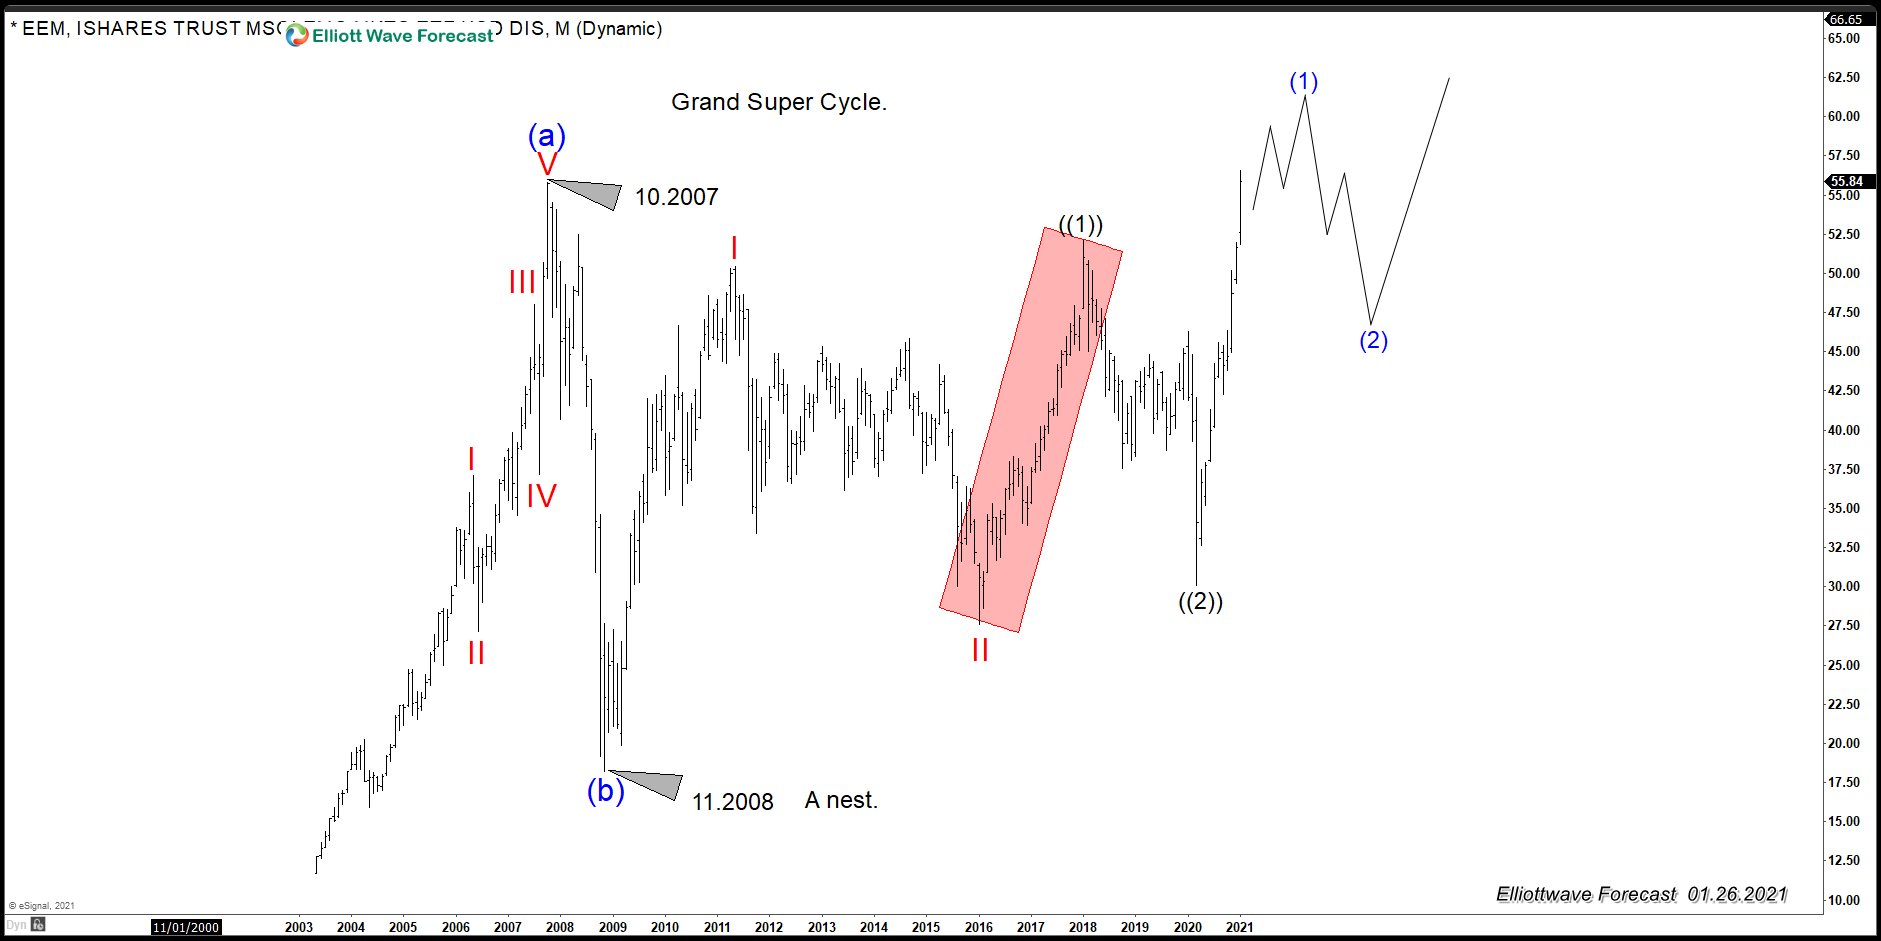
In the chart above, the cycle from wave ((2)) low might end soon but buying the next three waves pullback is a must. We always track these types of events across the market to keep our members on the right side. Some Indices like $SPY can show five waves, as shown in the following chart:
SPY Monthly Elliott Wave Chart

From the chart above, SPY can soon end 5 waves from all-time low and see a big pullback. However, EME is saying a nest can take place and the March 2020 drop was in fact only wave II of a second nest and now entering the powerful wave III. The following chart illustrates the next idea:
SPY Quarterly Elliottwave Chart – Nesting Structure
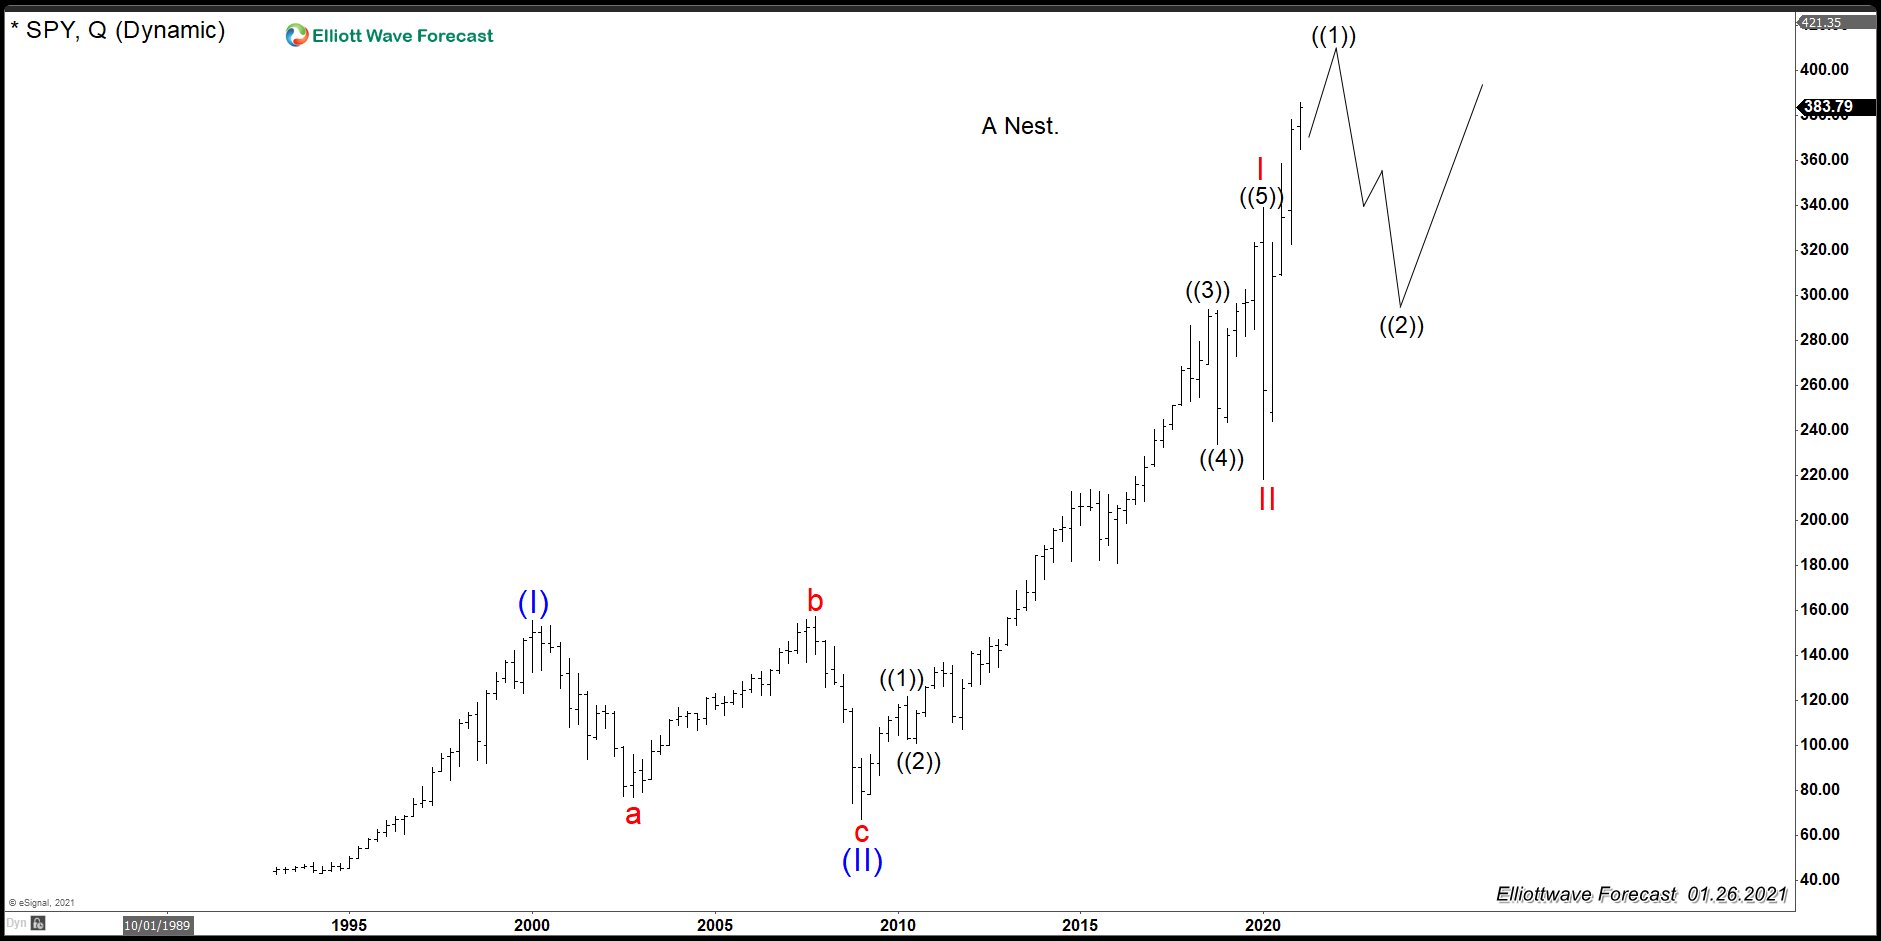
The chart above shows how the nest looks at $SPY. Consequently, although there will soon be a correction to the cycle which started from March 2020 low, after the correction is complete, a huge acceleration can happen across World Indices. Without correlation, a waver may conclude that a big crash can happen in world indices. However, we have added correlation and other tools to make the Theory better.
Source: https://elliottwave-forecast.com/stock-market/eem-can-be-nesting-supporting-world-indices/