
Deutsche Lufthansa AG is the largest German airline and behind Ryanair the second largest company in Europe in terms of the number of passengers. Founded in 1926 and headquartered in Cologne, Germany, it can be traded under the ticker $LHA at XETRA in Frankfurt. Besides its own services, Lufthansa owns Austrian Airlines, Swiss International Airlines, Brussels Airlines and Eurowings as subsidiaries. However, since 2018 highs, the stock price of Lufthansa was in a steady decline. Today, many observers relate the price fall to the economic struggling of the company following the COVID-19 lockdowns through Europe. However, downside stock price action does not fit well with the travel restrictions and lower numbers of passengers since the price correction has started 2 years before the first COVID-19 case.
Back in April 2020, we have provided Monthly, Weekly and Daily views on Lufthansa stock. We have shown that another marginal new low should take place. As a matter of fact, a new low towards 6.84 has happened. Currently, buyers can expect the uptrend to resume… despite lockdowns and travel restrictions.
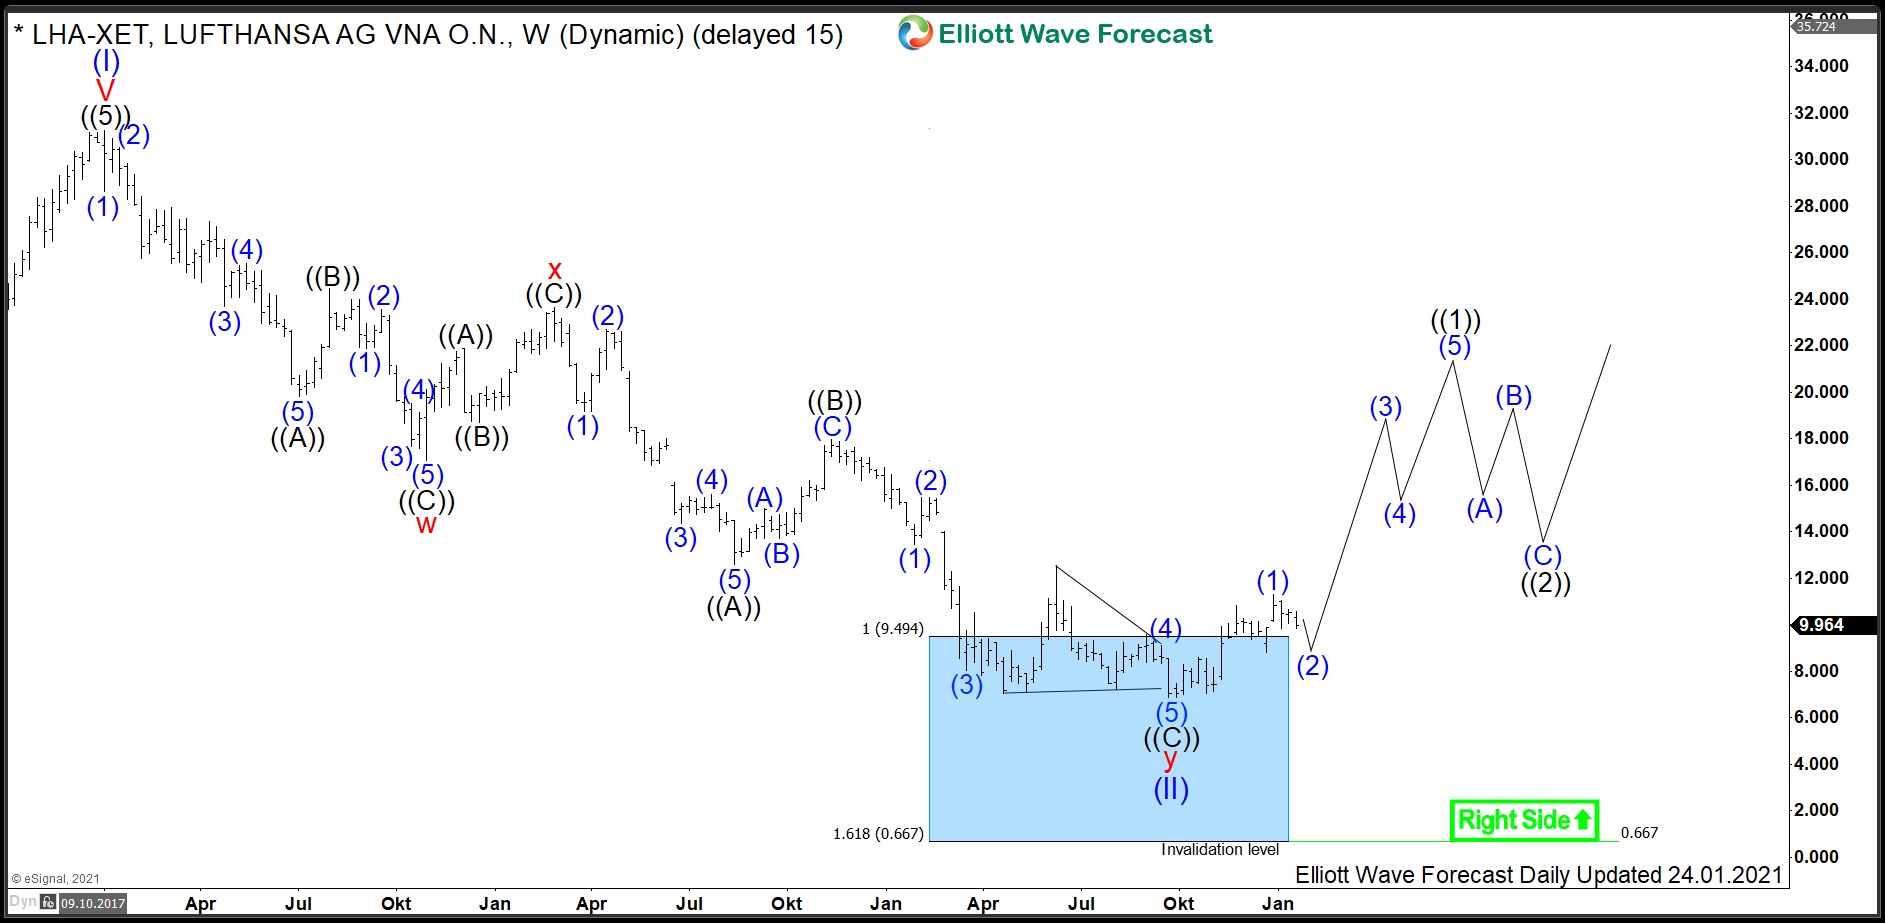
Lufthansa Weekly Elliott Wave Analysis 01.24.2021
First, the supercycle wave (I) has printed the all-time highs at 31.26 on January 2018. The structure of the rise has been shown in April 2020 article. Now, the Weekly chart below shows the entire correction of that cycle from the January 2018 highs in the blue wave (II) lower. The decline has unfolded as a double zigzag correction pattern, i.e., a 7 swings structure.
The red wave w has ended on October 2018, a connector in red wave x has printed its top on February 2019. From there, the 5th swing lower in black wave ((A)) has ended on August 2019 opening up a bearish sequence. After a bounce as a swing #6 in wave ((B)), the 7th swing lower in black wave ((C)) has extended lower and should have ended in September 2020 at 6.84 lows. The red wave y of blue wave (II) has already reached the extension area towards 9.49-0.66. There, buyers should have entered the market and can expect the blue wave (III) to extend towards the 31.26 highs and even beyond.
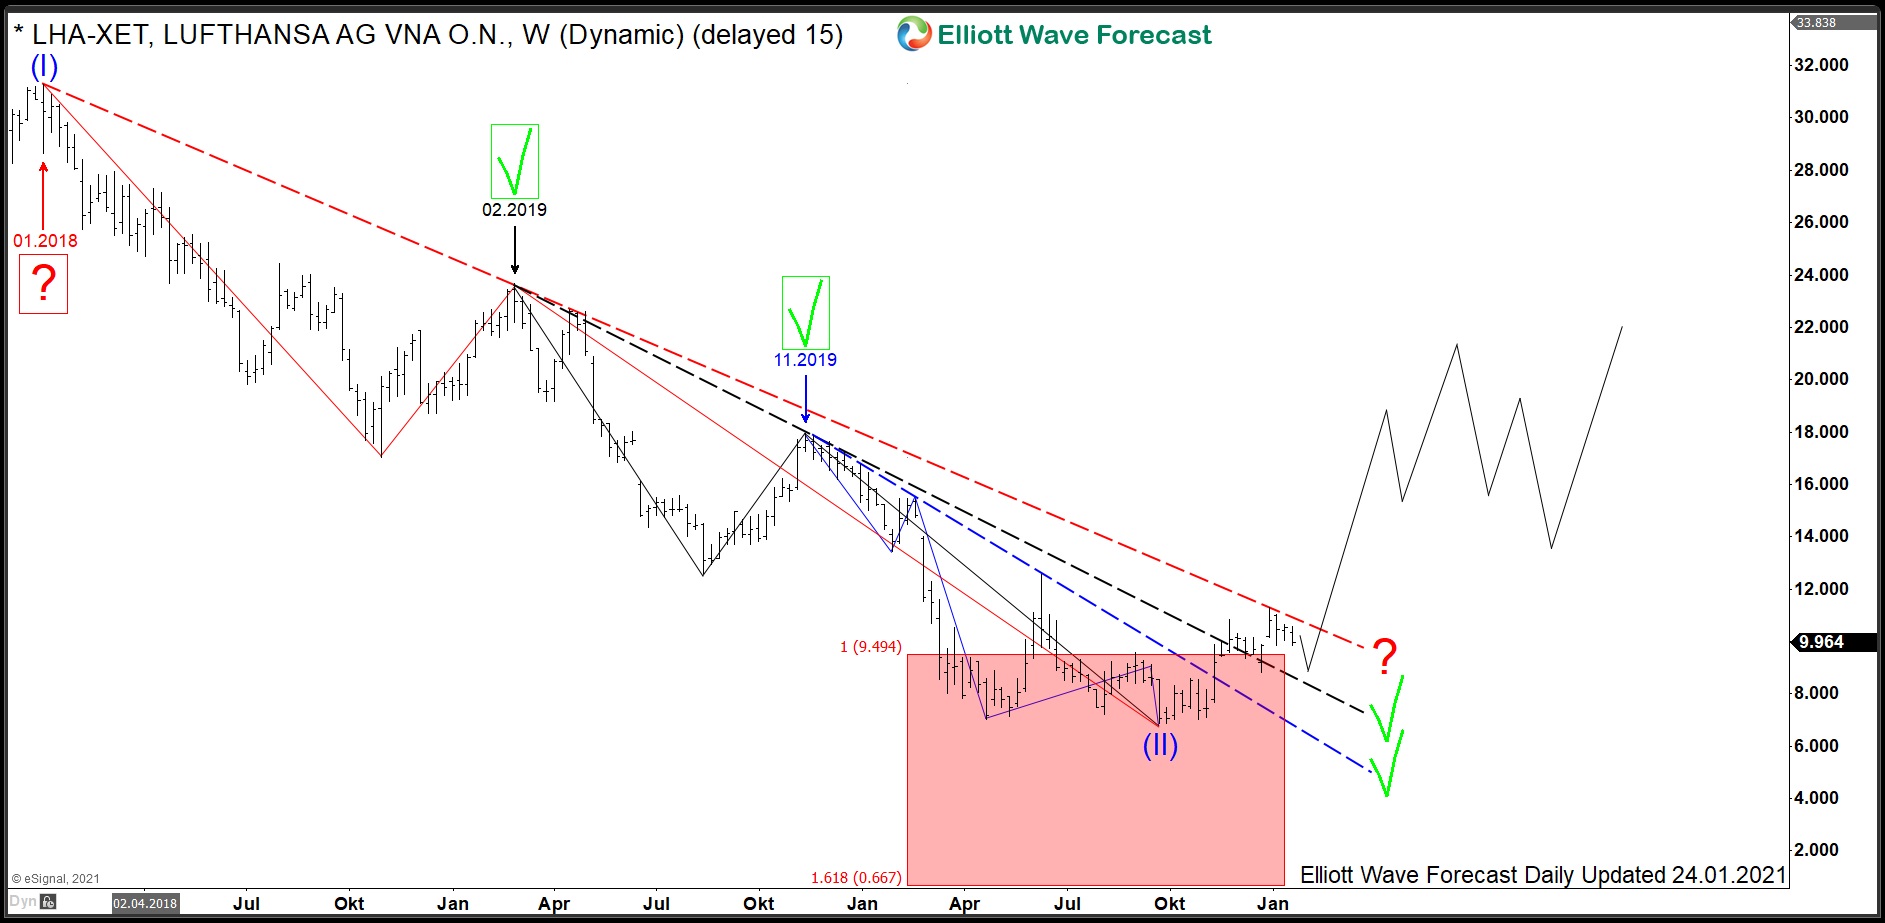
Lufthansa Weekly Cycle Analysis 01.24.2021
The supplementary chart below shows the ramping up price action through the trendlines. Hereby, no labels are necessary to understand the begin and the end of the cycles. First of all, the 5 waves cycle from November 2019 highs is the blue trajectory in the chart below. The price action has broken above the blue dashed trendline. That is a proof that the cycle from November 2019 highs has ended.
Secondly, the 3 waves cycle lower from February 2019 highs is the black trajectory. The break above the black dashed trendline provides a confirmation that also the February 2019 cycle has ended. Now, the red dashed trendline is still holding. Technically, Lufthansa may still break below 6.84 lows. However, that action will open a bearish sequence against December 2020 highs forcing additional 3 swings lower along the black trajectory. As a consequence, the price target will fall under the zero line. The lack of space, however, makes that scenario very unprobable.
Analyzing the structure of the rise, the 5 waves up from the September 2020 lows require at least another swing higher. That swing, in fact, will most probably break above the red dashed trendline. Once it happens, the cycle lower in 3 swings from the January 2018 highs corresponding to the red trajectory will be accomplished. Hence, the entire correction from the all-time highs in blue wave (II) will end.
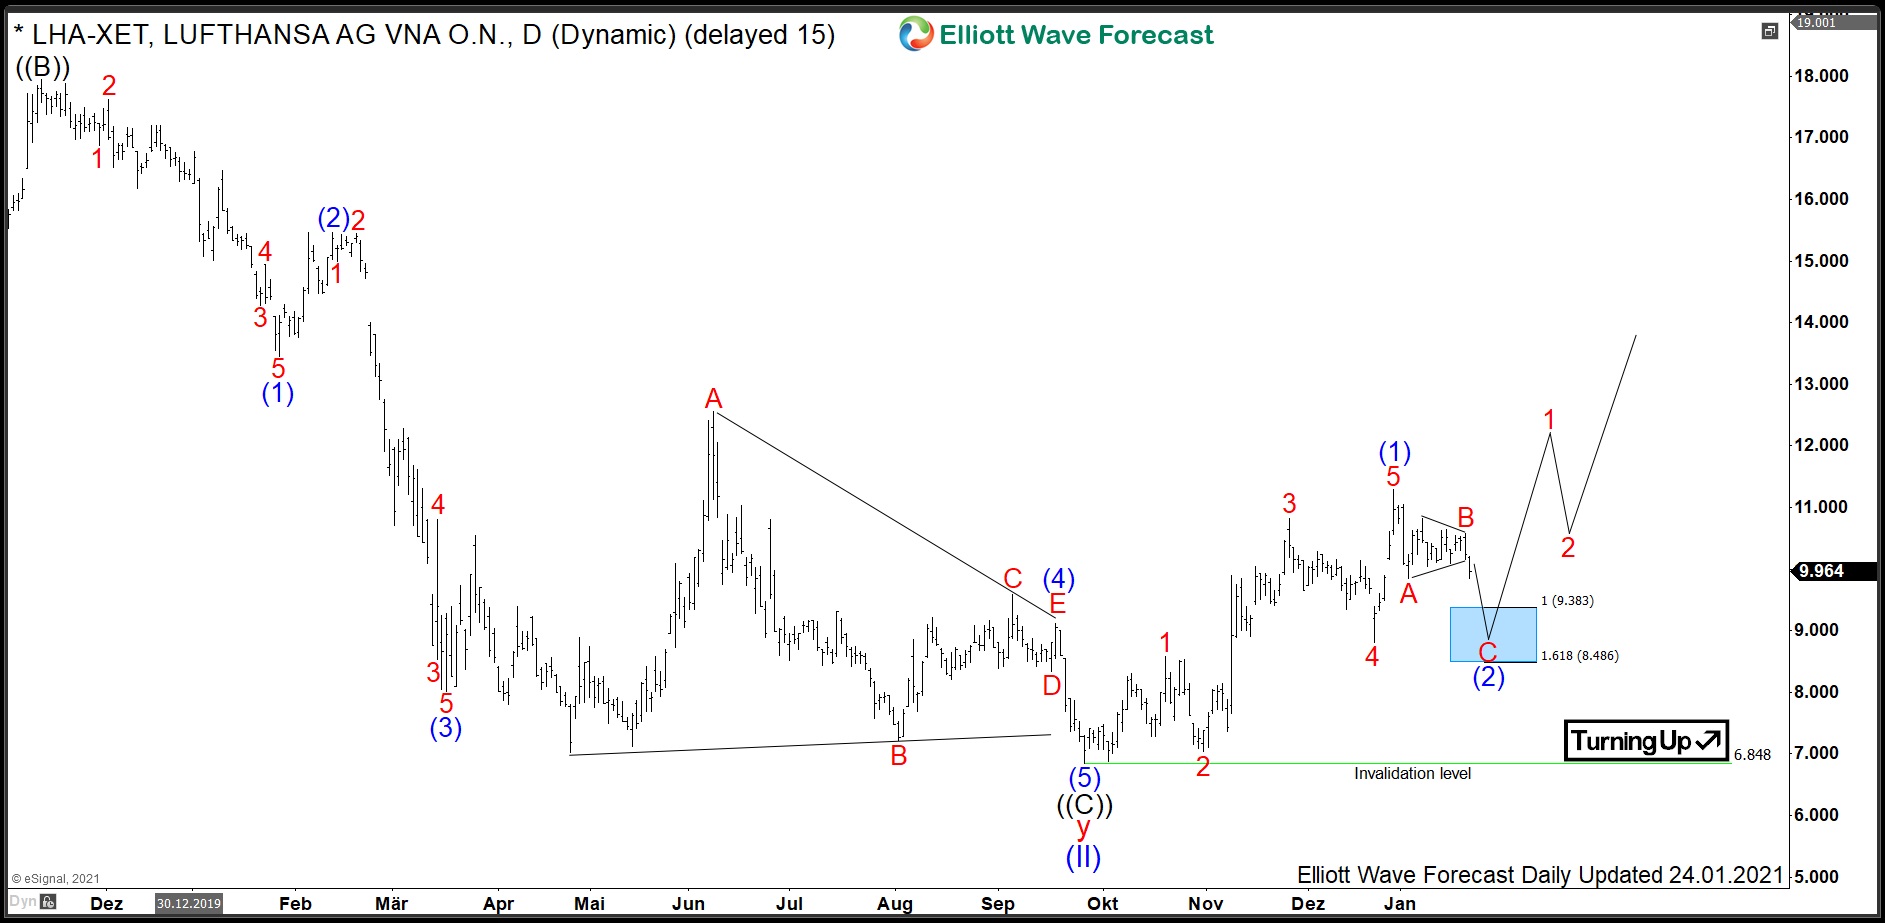
Lufthansa Daily Elliott Wave Analysis 01.24.2021
The daily chart below shows in more detail the advance in blue wave (1) from the September 2020 lows at 6.84. Hereby, one can clearly see an impulse higher. As a matter of fact, red wave 3 has extended beyond 1.618 multiples of the red wave 1. The motive wave (1) has ended on December 2020 at 11.29 highs. Currently, the blue wave (2) is correcting lower the September cycle and should find support in 3, 7 or 11 swings above 6.84 lows. In shorter cycles, 3rd swing lower in red wave C of (2) should find support from 9.38-8.48 blue box area for a rally in wave (3) towards 11.29 and higher or provide a 3 waves bounce at least.
Source: https://elliottwave-forecast.com/stock-market/lufthansa-ramping-lockdowns/