In this technical blog we’re going to take a quick look at the Elliott Wave charts of FTSE index published in members area of the Elliottwave-Forecast . As our members know FTSE reached our target zone in the June cycle at 639.9-5231.02 area and found buyers. FTSE is another instrument that has given us nice rally from the Blue Box area recently. The index ended cycle from the June 8th peak as Double Three pattern. Which is also know as 7 swings. In further text we’re going to explain the forecast and Elliott Wave Pattern.
Before we take a look at the real market example, let’s explain Elliott Wave Double Three pattern.
Elliott Wave Double Three Pattern
Double three is the common pattern in the market these days, also known as 7 swing structure. It’s a reliable pattern which is giving us good trading entries with clearly defined invalidation levels and target areas.
The picture below presents what Elliott Wave Double Three pattern looks like. It has (W),(X),(Y) labeling and 3,3,3 inner structure, which means all of these 3 legs are corrective sequences. Each (W) and (Y) are made of 3 swings , they’re having A,B,C structure in lower degree, or alternatively they could have W,X,Y labeling.

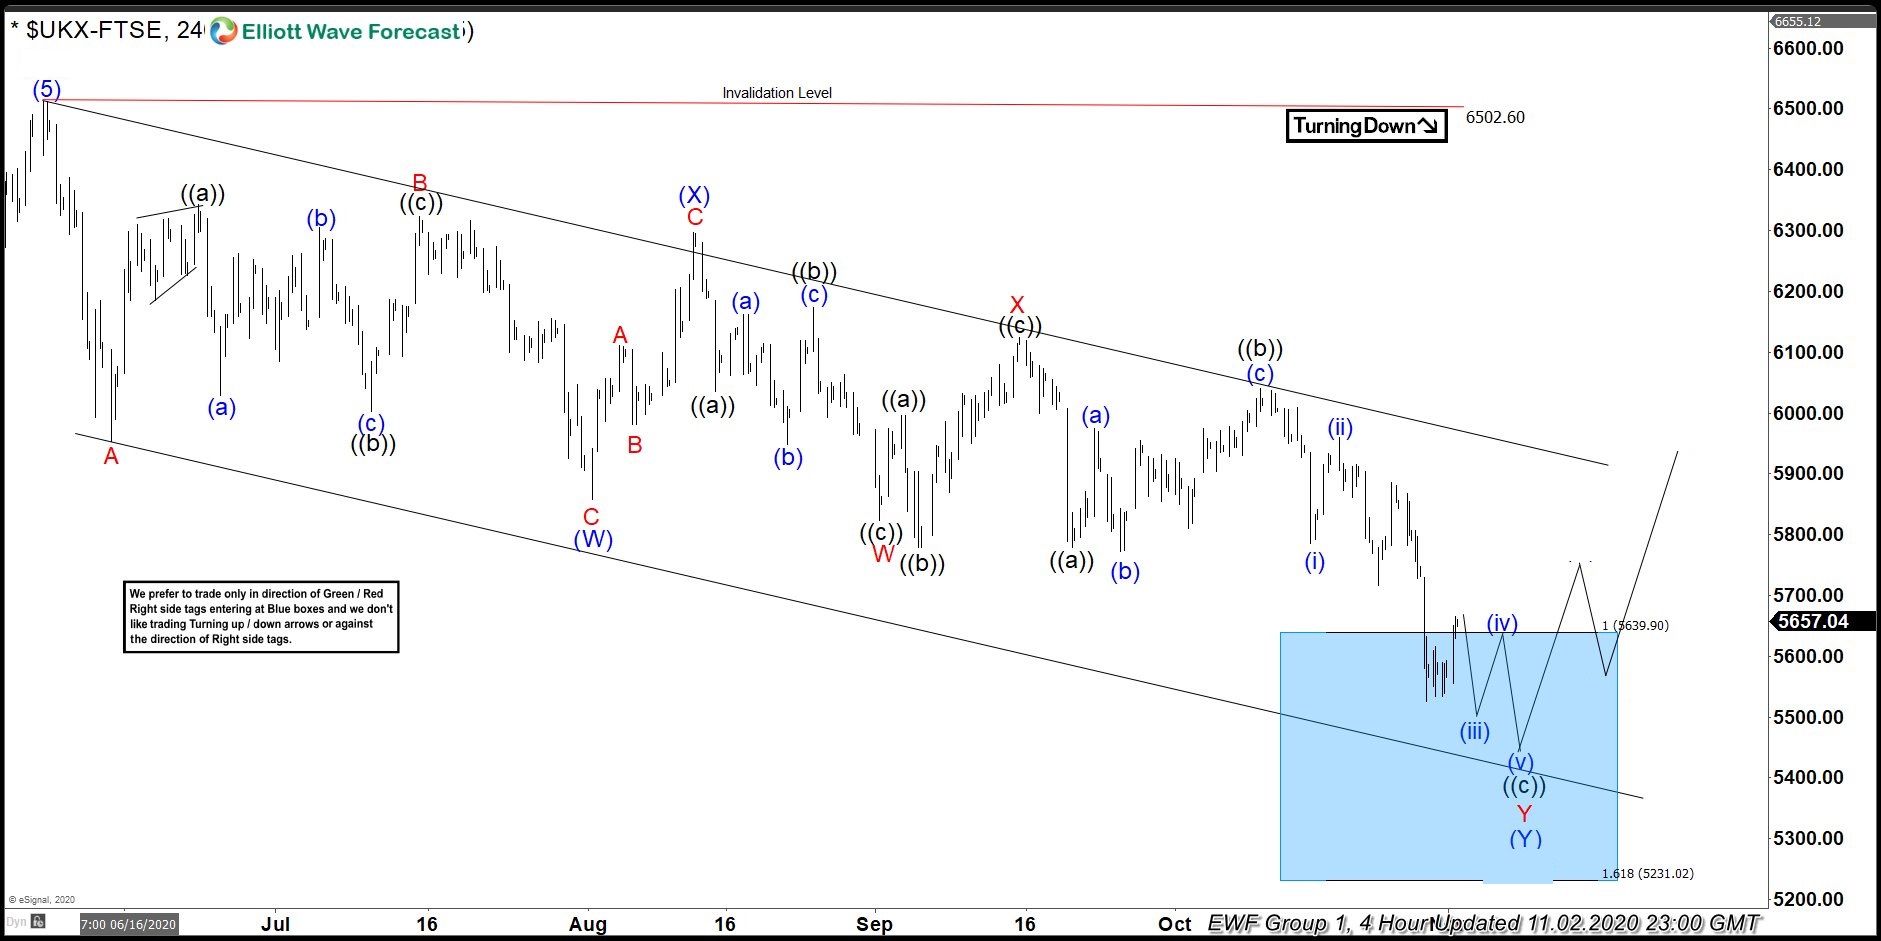
FTSE 4 Hour Elliott Wave Analysis 11.02.2020
At the chart below we can see clear 7 swings in the cycle from the 6502.6 high. Double three pattern has inner labeling: (W)(X)(Y) blue. Each leg of the pull back has corrective structure, when (W) leg has ABC inner labeling, while (Y) leg is double three WXY red. At this moment we can count clear 7 swings down from the June 8th peak . Pull back has already reached equal legs zone at 639.9-5231.02 area . Consequently, turn higher can happen any moment. We don’t recommend selling anymore and expect rally from the blue box to happen soon. Proposed leg down may or may not happen.
As our members know Blue Boxes are no enemy areas , giving us 85% chance to get a bounce.You can learn more about Elliott Wave Double Three Patterns at our Free Elliott Wave Educational Web Page.
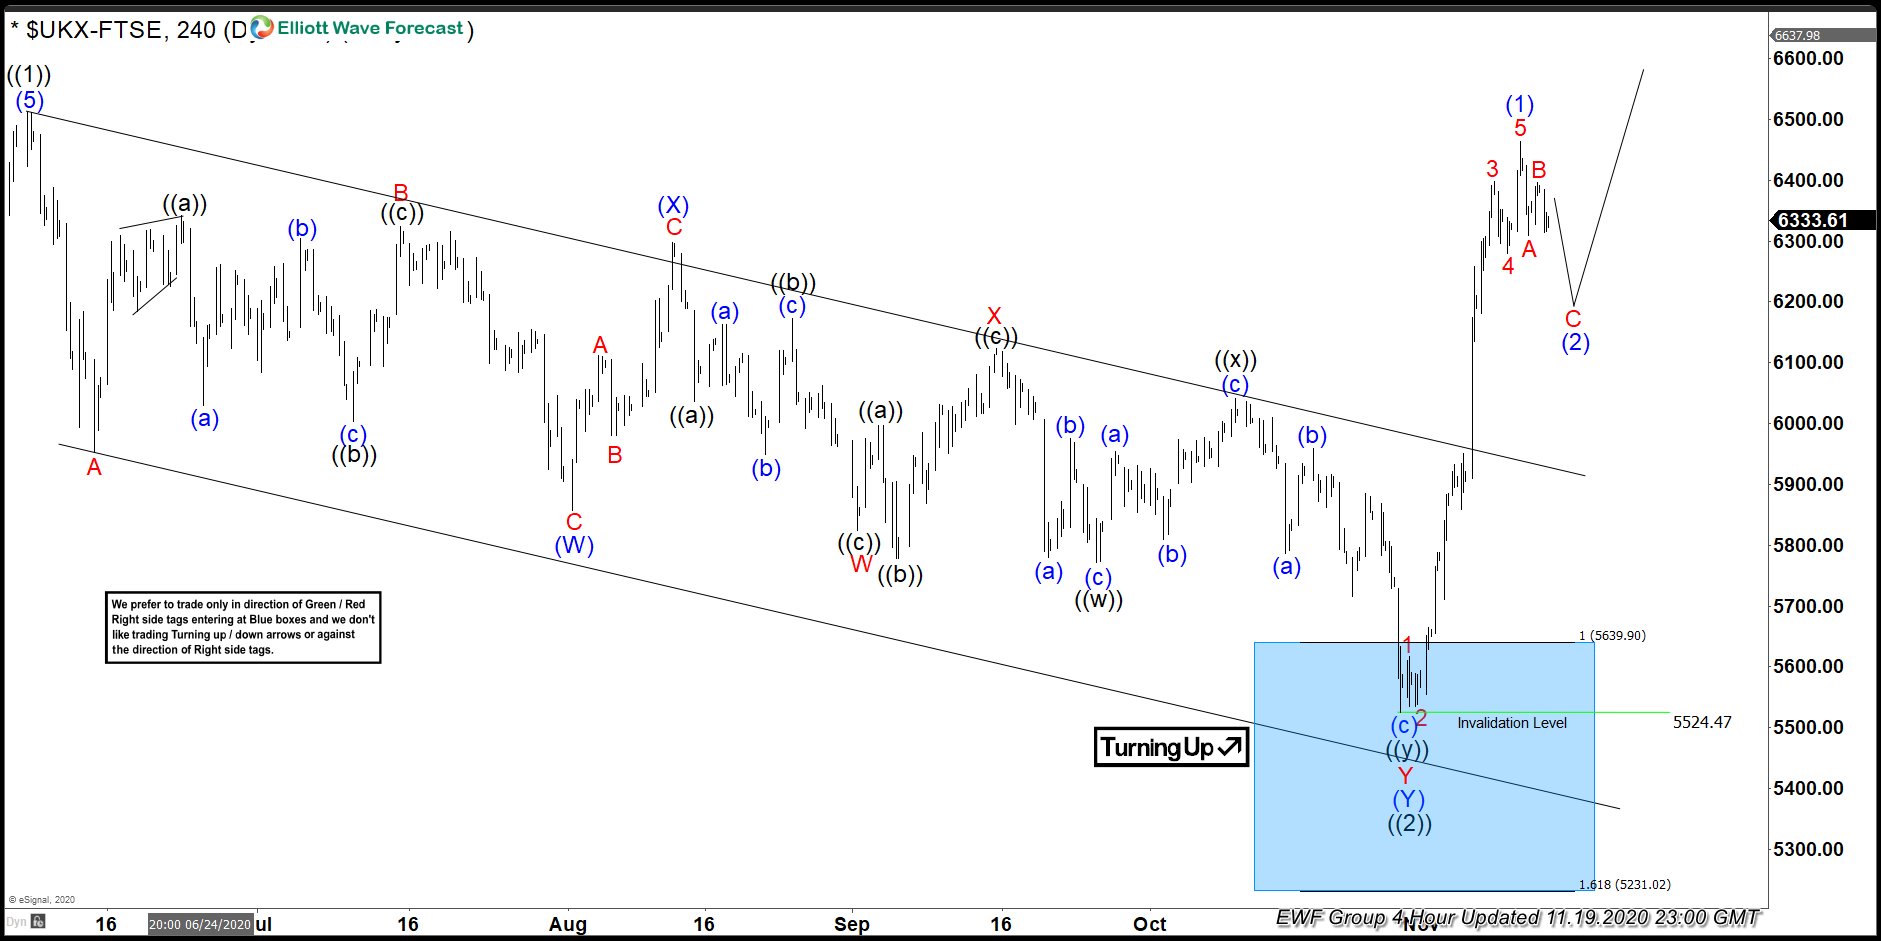
FTSE 4 Hour Elliott Wave Analysis 11.10.2020
FTSE keep finding buyers and ended cycle from the June peak right at the blue box : 639.9-5231.02 are. Pull back ended at 5524.47 as Double Three and we got nice rally. Short term cycle from the 5524.47 low is having impulsive sequences. Consequently we expect further rally once (2) blue pull back completes.
Keep in mind that market is dynamic and presented view could have changed in the mean time. You can check most recent charts in the membership area of the site. Best instruments to trade are those having incomplete bullish or bearish swings sequences. We put them in Sequence Report and best among them are shown in the Live Trading Room.
Elliott Wave Forecast