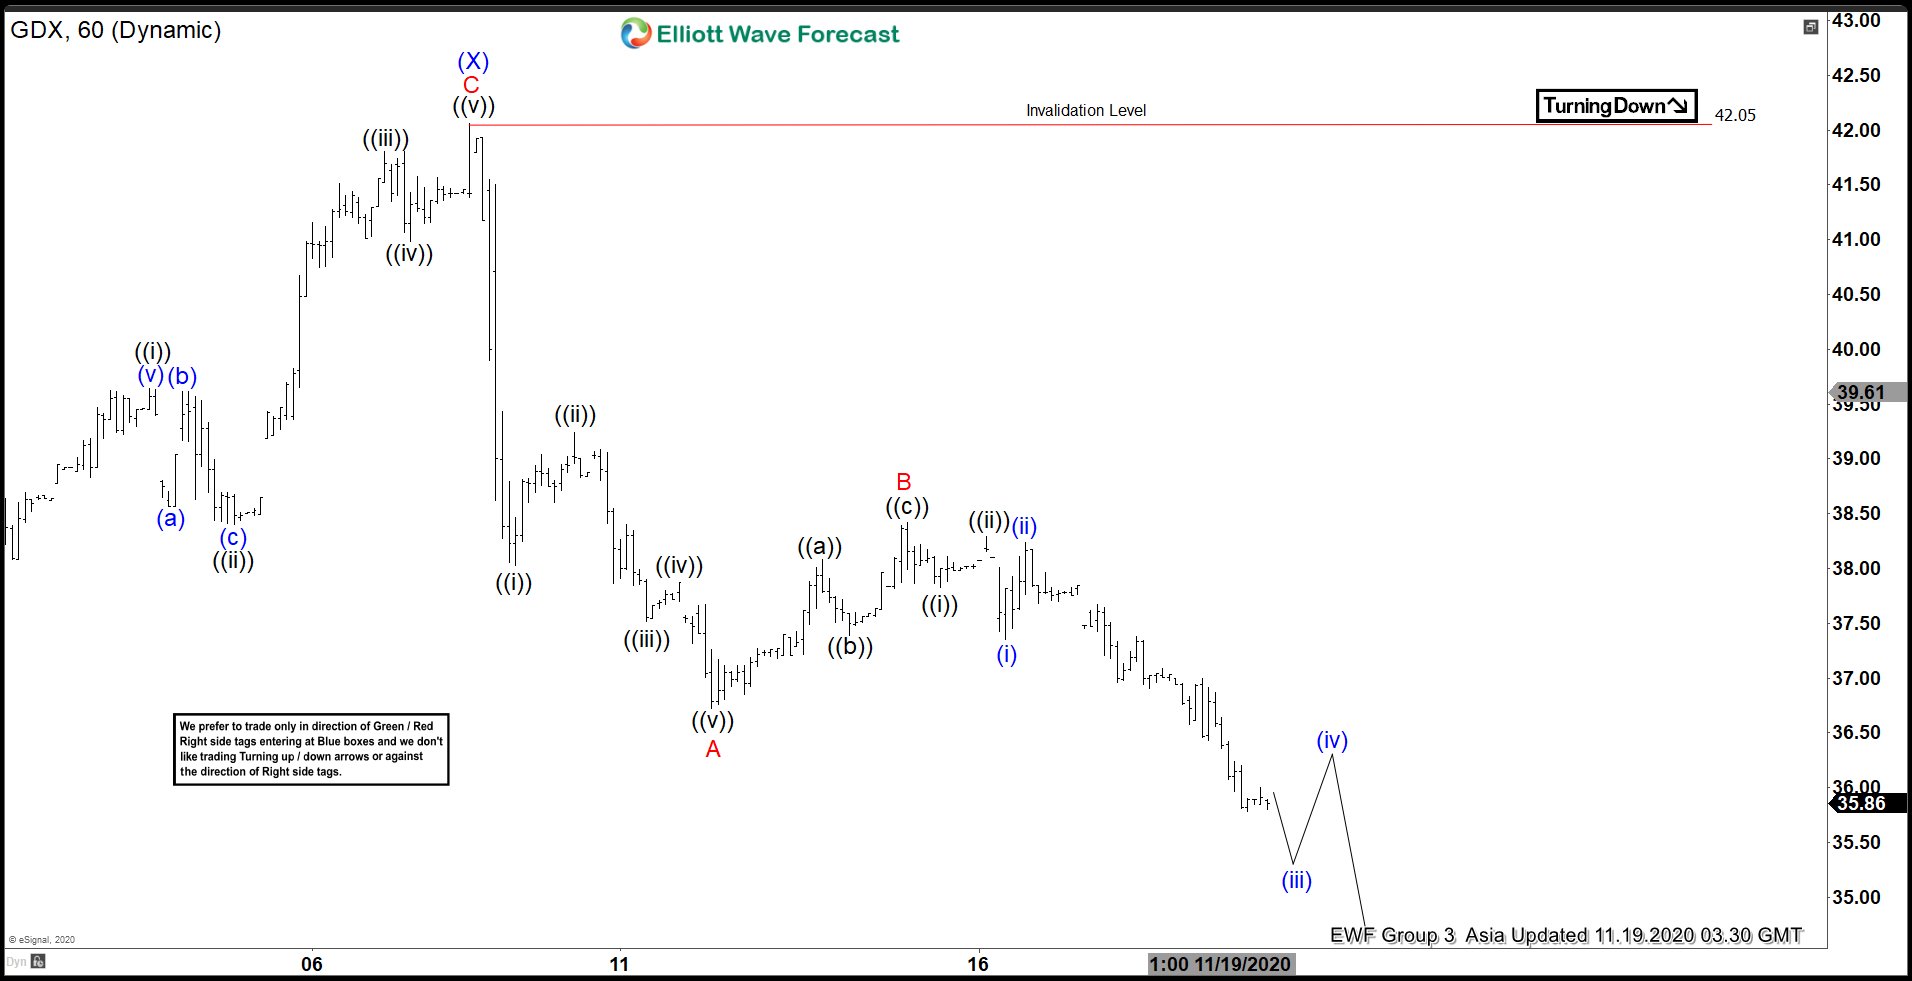
Elliott Wave view in Gold Miners (GDX) suggests the Index is correcting the cycle from March 16, 2020 low. The correction is unfolding as a double three Elliott Wave Structure. In the 60 minutes chart below, we can see wave (X) of this double three ended at $42.05. The Miners have turned lower in wave (Y).
The internal of wave (Y) is unfolding as a zigzag Elliott Wave structure. Down from wave (X) high at $42.05, wave ((i)) ended at $38.03, and bounce in wave ((ii)) ended at $39.24. Index resumes lower in wave ((iii)) towards $37.52, wave ((iv)) ended at $37.87, and wave ((v)) ended at $36.73. This ended wave A of (Y) in higher degree.
Index then bounced in wave B which ended at $38.42. Internal structure of wave B unfolded as a zigzag where wave ((a)) ended at $38.08, wave ((b)) ended at $37.39, and wave ((c)) ended at $38.42. The Gold Miners have extended lower in wave C. Down from wave B high at $38.42, wave ((i)) ended at $37.83 and wave ((ii)) ended at $38.29. Expect a few more lows in the Index to end wave C of (Y) before GDX finds support. A potential support area is 100% – 123.6% Fibonacci extension from August 5, 2020 high which comes at $31.05 – $33.10.
GDX 60 Minutes Elliott Wave Chart