
Last week, the US general election took place. The whole world was in the edge about the results. Many headlines have happened since November 3rd. We have been waiting for four days until finding a result that the current president still does not accept. Traders have been at the edge and stay in front of computers and TV trying to trade the market and guess how the outcome will affect their positions.
We at EWF forecast 78 instruments in four different time frames and provide several updates per day. Are we also staying in front of the TV waiting for the headlines? Of course not. It is almost impossible to do that because of the amount of work that takes to complete a chart update. Our forecast uses a combination of Elliott Wave, cycles, distribution, and correlation, among other things.
However, one thing which is not part of our forecasting system is the fundamentals or news events. Going into the election time, we were expecting the Indices to reach buying areas. Some Indices reached the buying area last week, and we were expecting Indices to extend higher higher after the correction from September 2020 high ends. Our system’s simple rule is to buy/sell the trend in three, seven, and eleven swing. We develop this 3, 7, 11 system, which is the nature of the corrective path. We do understand that we do not make the market. However, we also understand how it works and consequently, we trade with the market’s nature.
Elliott Wave Zigzag Corrective Structure
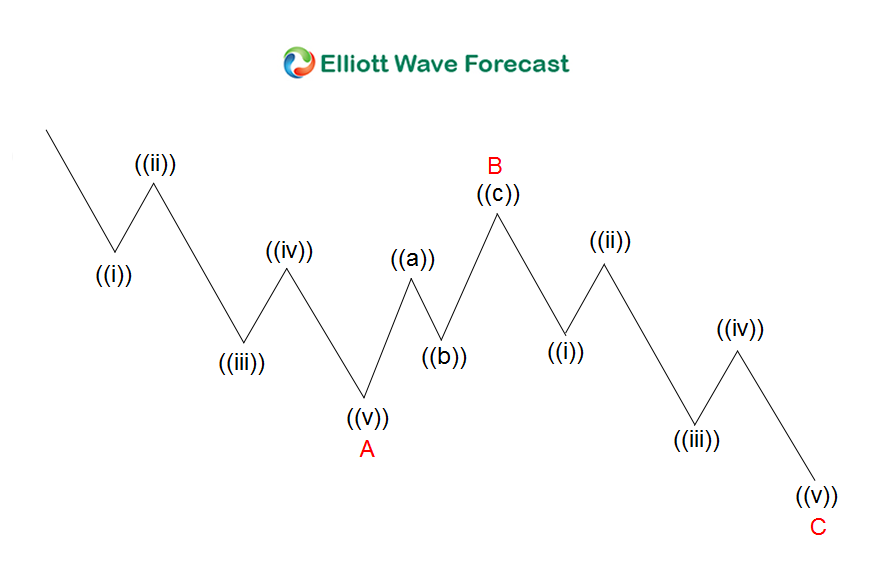
The graphic above is a representation of zigzag (ABC) structure. It is a corrective sequence of 5-3-5 and 85% of the time will end between 100% to 161.8% of the A leg related to the B. This is a simple corrective pattern. Buying and selling within the 100% -161.8% area of C=A is a high probability trade. At minimum this will result in a bounce in either a wave 4 or wave X which is all we need.
We trade at the no-enemy zone which by definition is an area where both buyers and sellers agree for a bounce. Remember, we do not control what the market will do, so we need to trade smart.
Double Three Elliott Wave Structure
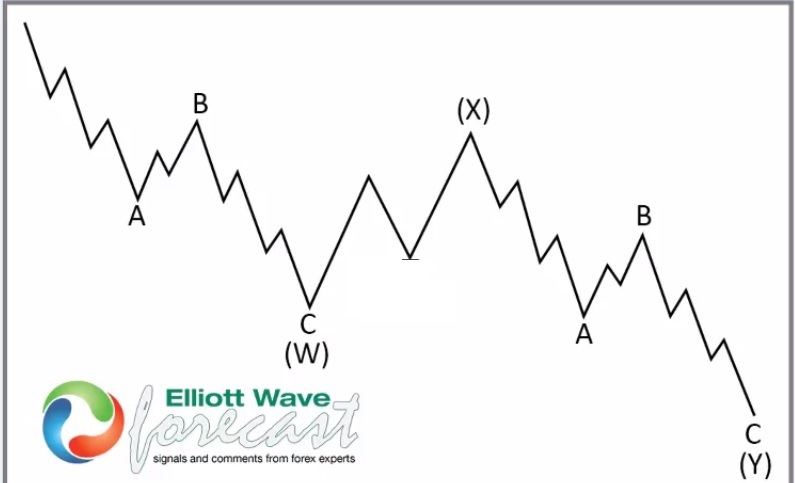
The graphic above is a representation of a WXY double three structure. This is a seven swing structure which happens to be a sequence of 5-3-5-3-5-3-5. The sequence in a simple way is a two set of of ABC (a double zigzag). Again, we like to buy/sell the 100%-1.618% of the (Y) related with (W) with the higher degree trend. As we buy/sell the area, we are expecting a bounce in 3 waves at least.
Going into the US General Election, our position across world indices were very clear. We like to buy the 100%-1.618% extension from the September 2020 peak. As we always say, there’s no such thing as a perfect alignment in which each world index is able to reach the buying area at the same time.
Perfect alignment is almost impossible to achieve. We do not make the market, we are just traders looking for any world index that reaches the area. We then go long the market at the extreme 100% – 161.8% extension area waiting for a reaction. At EWF, we try to get in the market the smart way. We take what the market gives us. We avoid overtrading and adjust to the unexpected market moves as soon as we can. It will be unrealistic to think that every single chart will work or every target will be reached. That simply will not happen.
The idea of this article is to show a realistic way of trading and show how some world indices reached our entries and some did not. We want to make it clear that we are not perfect because nobody is, even the Market makers.
Dow Jones Futures (YM_F) 4 hour Elliott Wave Chart from 31 October
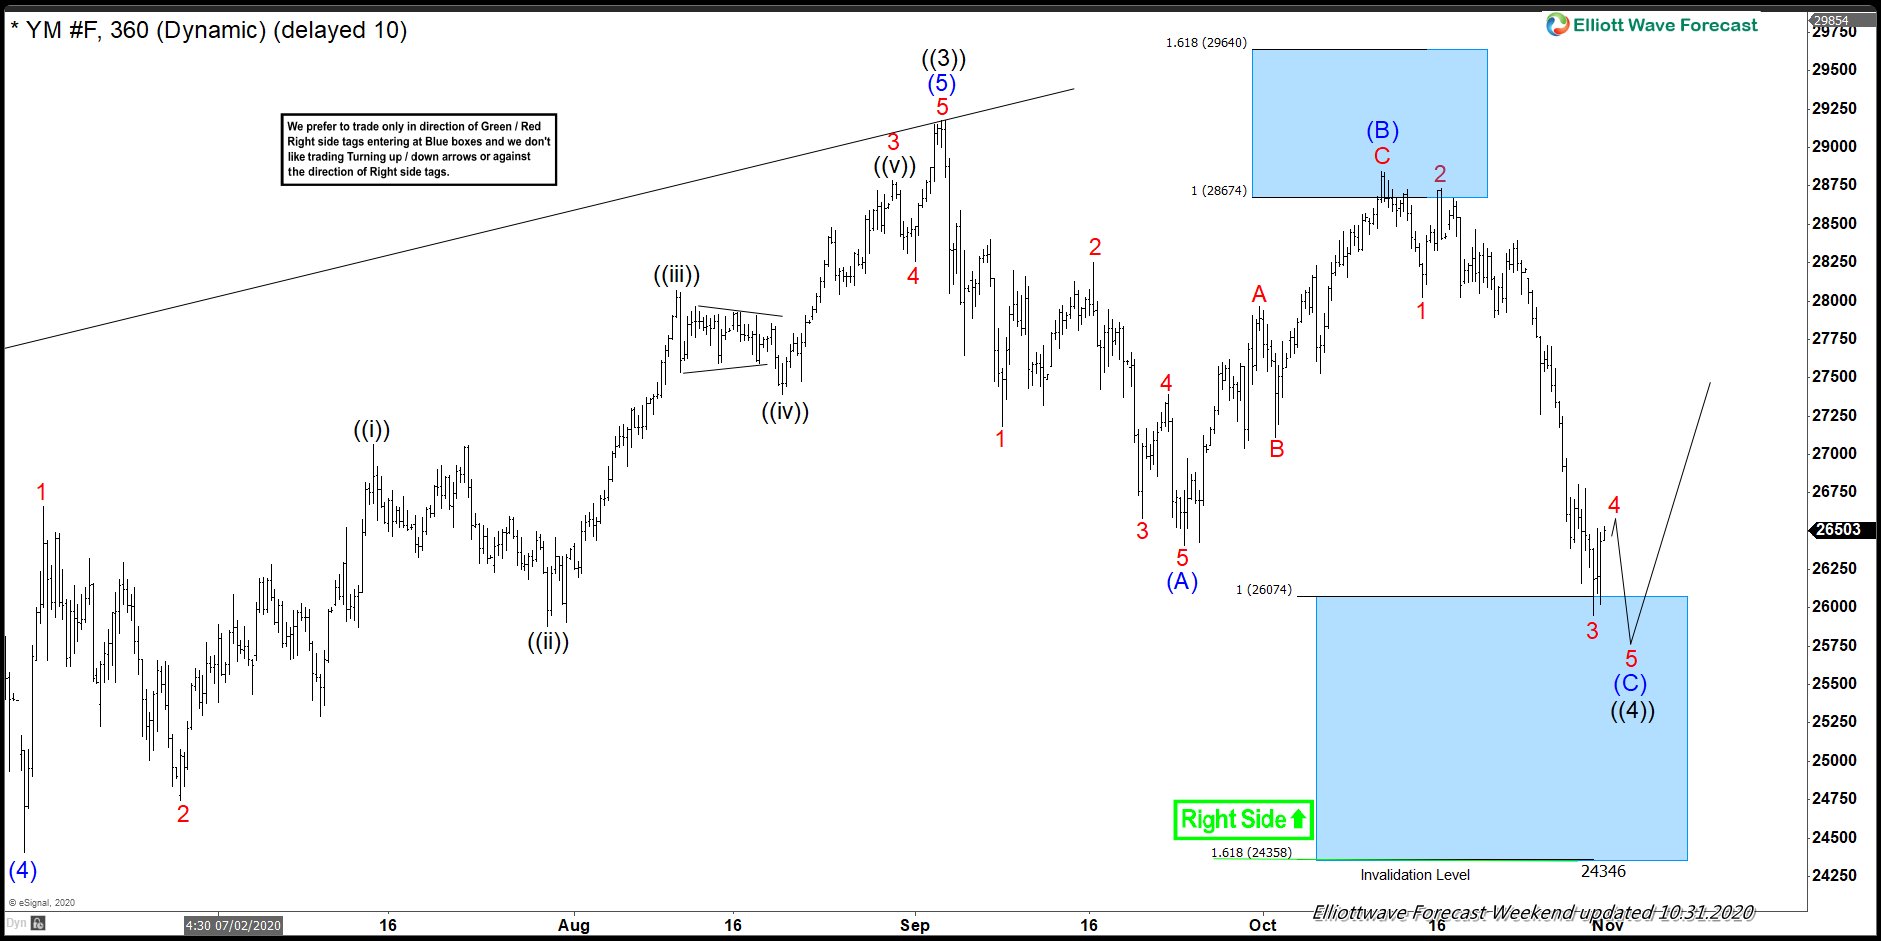
The chart above is the Dow Futures ($YM_F) chart presented to members during the weekend update before the US General Election. We were expecting the market to react from the blue box area in a minimum of three ways. We presented the Blue Box and the right side tag to the upside.
Dow Jones Futures (YM_F) 4 hour Elliott Wave Chart from 7 November

The chart above is the latest 4 Hour chart of Dow Jones Futures (YM_F) for members. The market reached the blue box area and reacted higher. Our members were able to enter and now it is waiting for the Market to decide whether it makes a new high or it just bounces in three waves and turns lower again. Regardless, if buying at the blue box, position is now risk free (stop moved to entry level).
S&P 500 (SPX) 4 Hour Elliott Wave Chart from 22 October
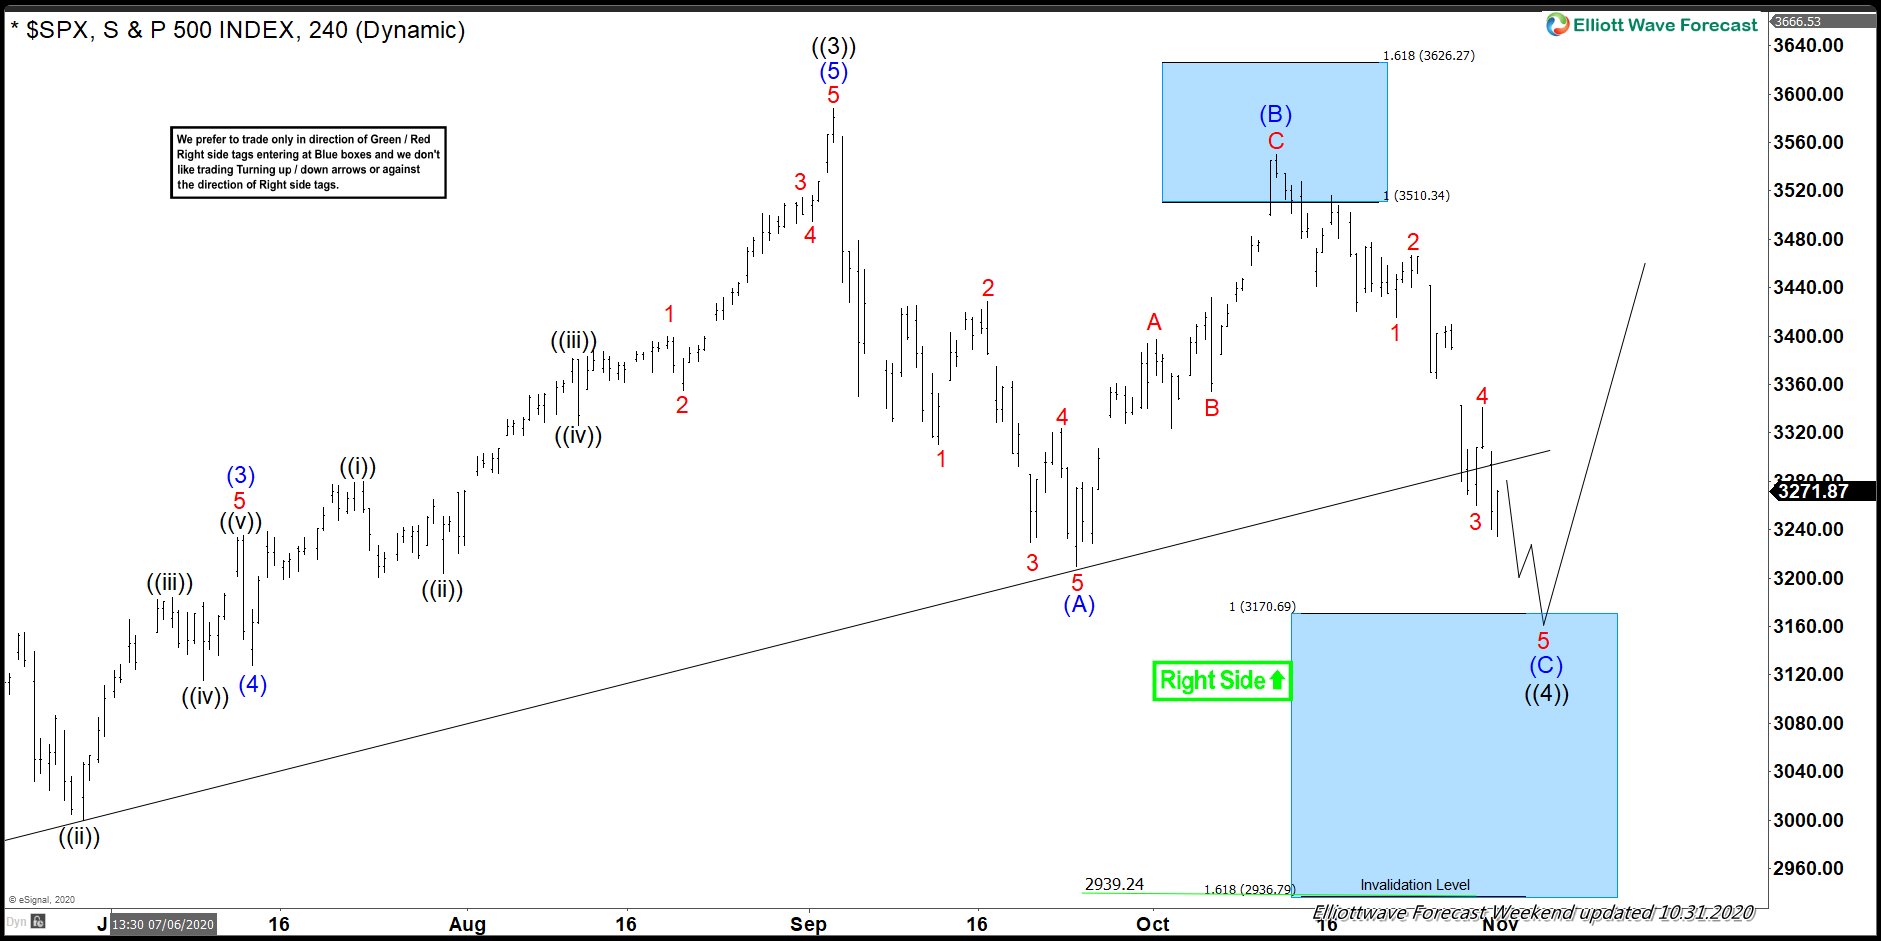
The chart above is the S&P 500 ($SPX) presented to members during the Weekend update before the US General Election. We were expecting the index to react from the blue box buying area. Unfortunately, the Index did not reach the blue box, and we were forced to adjust at the moment we know the move lower has been negated. But one thing is clear, we were never looking to sell despite the chart calling it lower to the blue box. We only looked to buy the dips.
S&P 500 (SPX) 4 Hour Elliott Wave Chart from 3 November
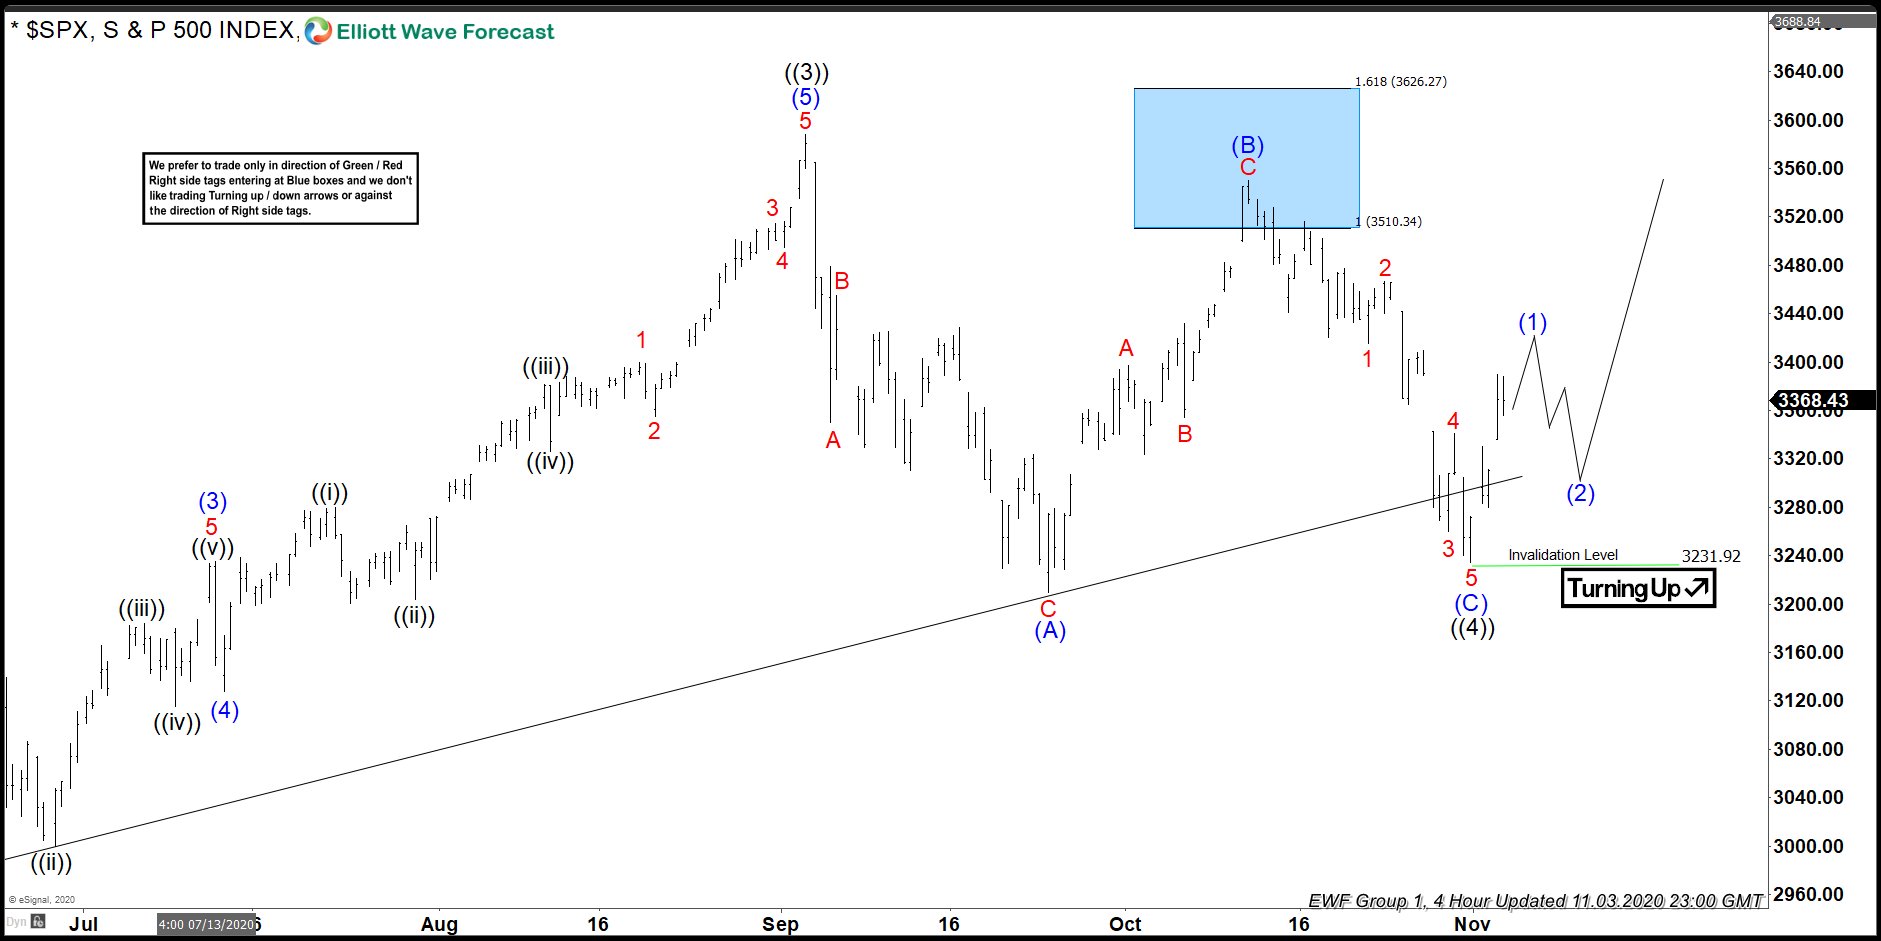
The chart above is 4 hour chart of $SPX from 3 November to members. At that moment, we identify that the Index will not reach the blue box area, thus we adjusted. As we always said, we are a forecaster and not market makers, so we have to adjust.
XLV 4 Hour Elliott Wave Chart 31 October
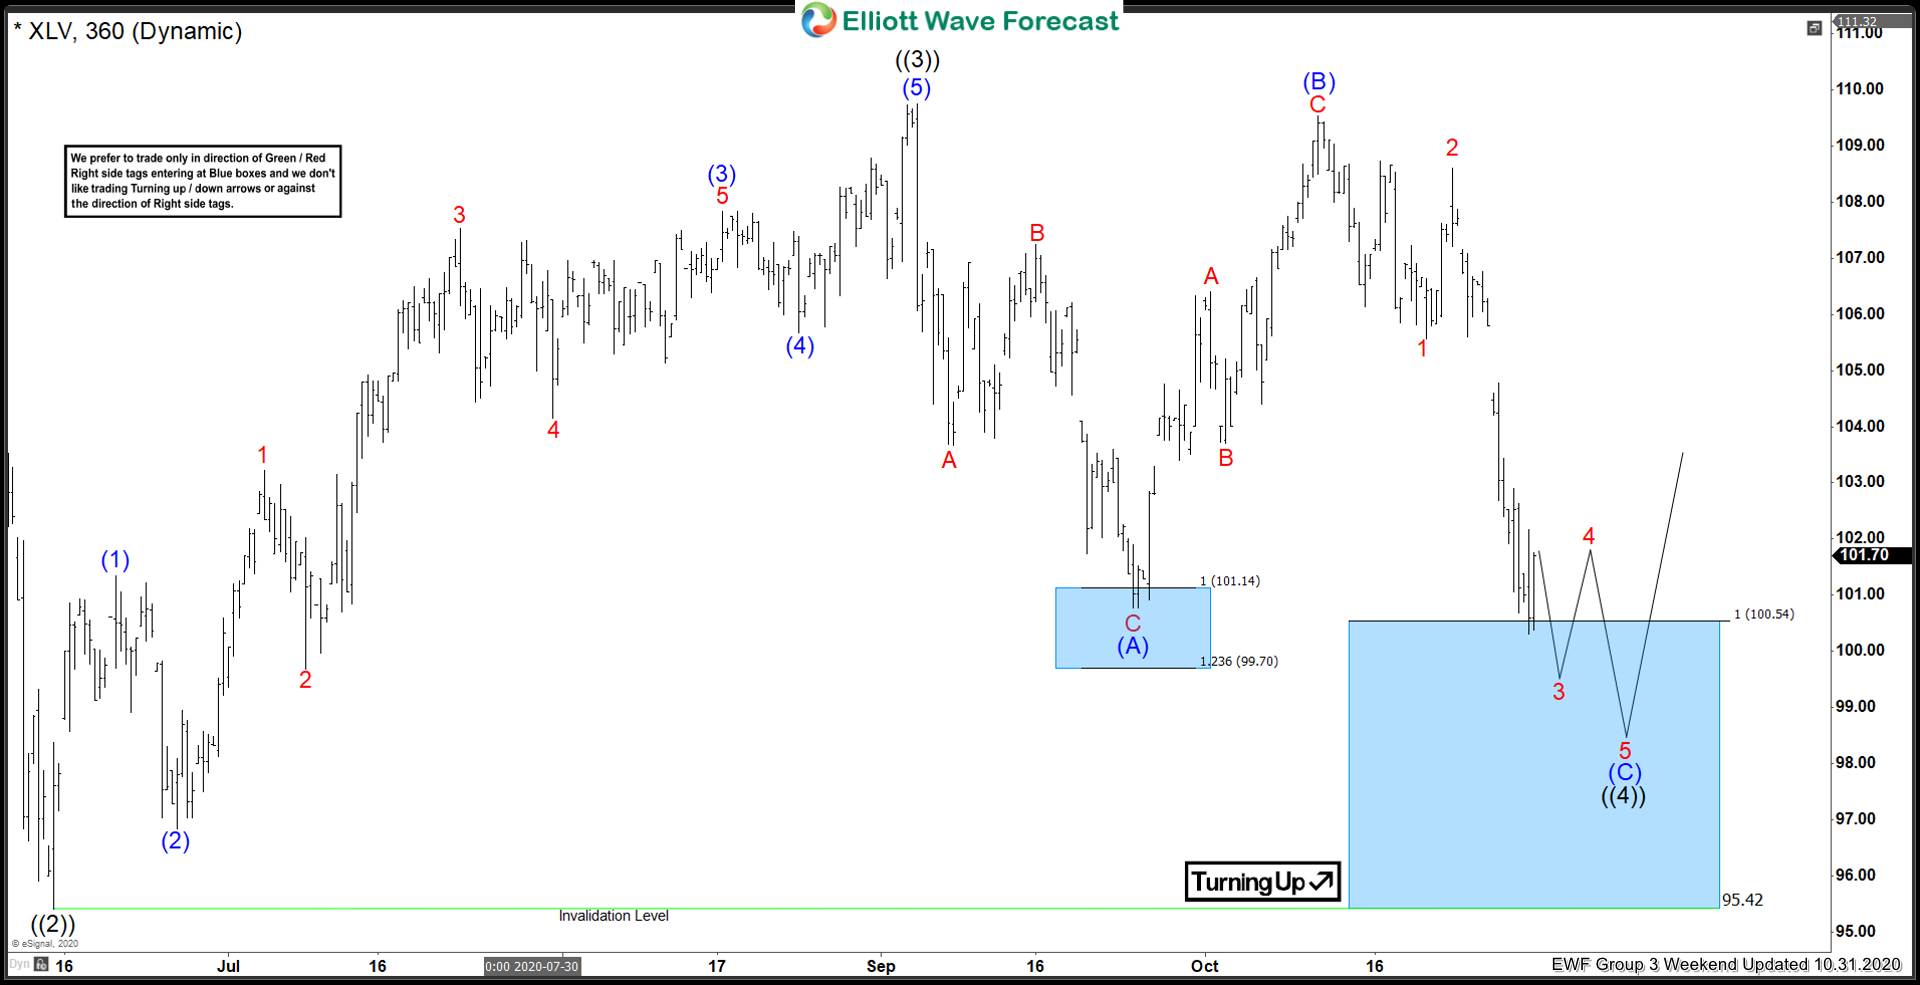
The chart above is the 4 Hour chart of $XLV presented to members during the Weekend update before the US General Election. It shows the Blue Box buying area and expected next move.
XLV 4 Hour Elliott Wave Chart 7 November
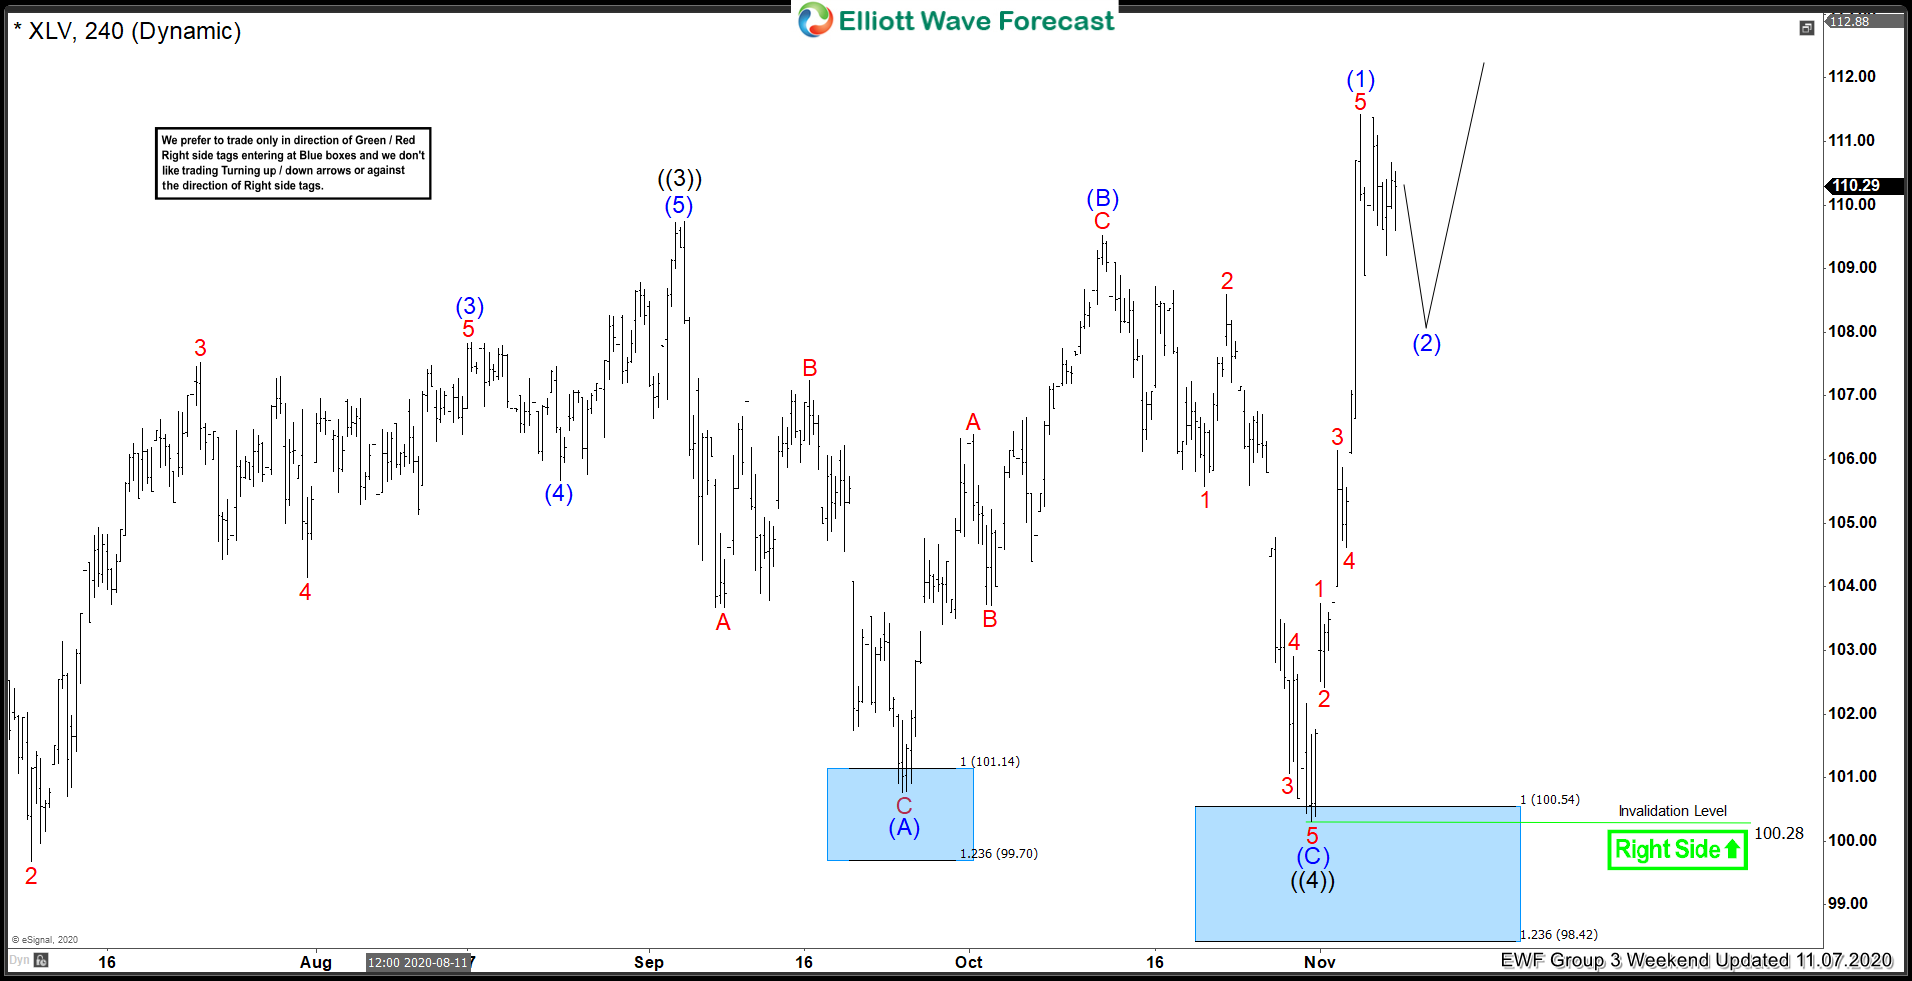
The chart above is the latest $XLV 4 Hour chart presented to members. As we can see, the market reached the blue box and already makes new highs. As always, we trade as hunters looking for the opportunities to enter and waiting for the reaction without any control.
NIFTY 4 Hour Elliott Wave Chart from 1 November
The chart above is the $Nifty 4 Hour chart to members before the US General Elections. We were buying the Blue Box and expecting new highs.
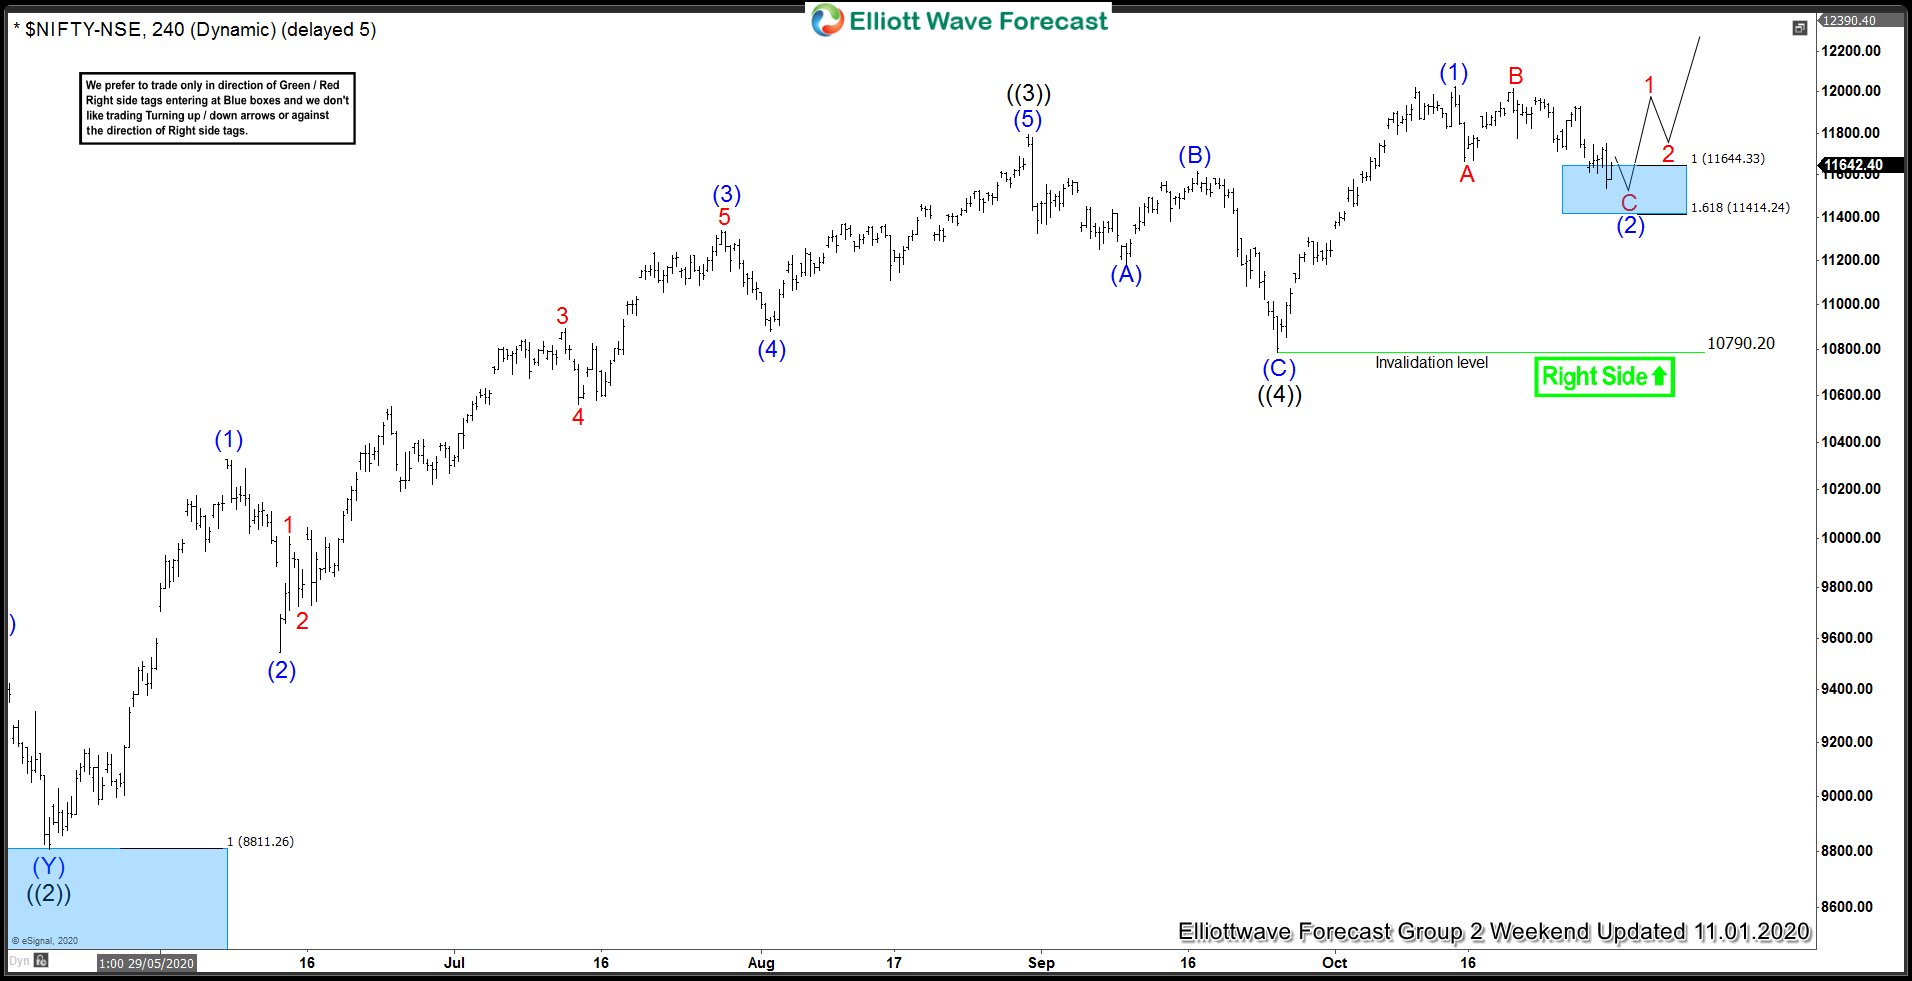
NIFTY 4 Hour Elliott Wave Chart from 6 November
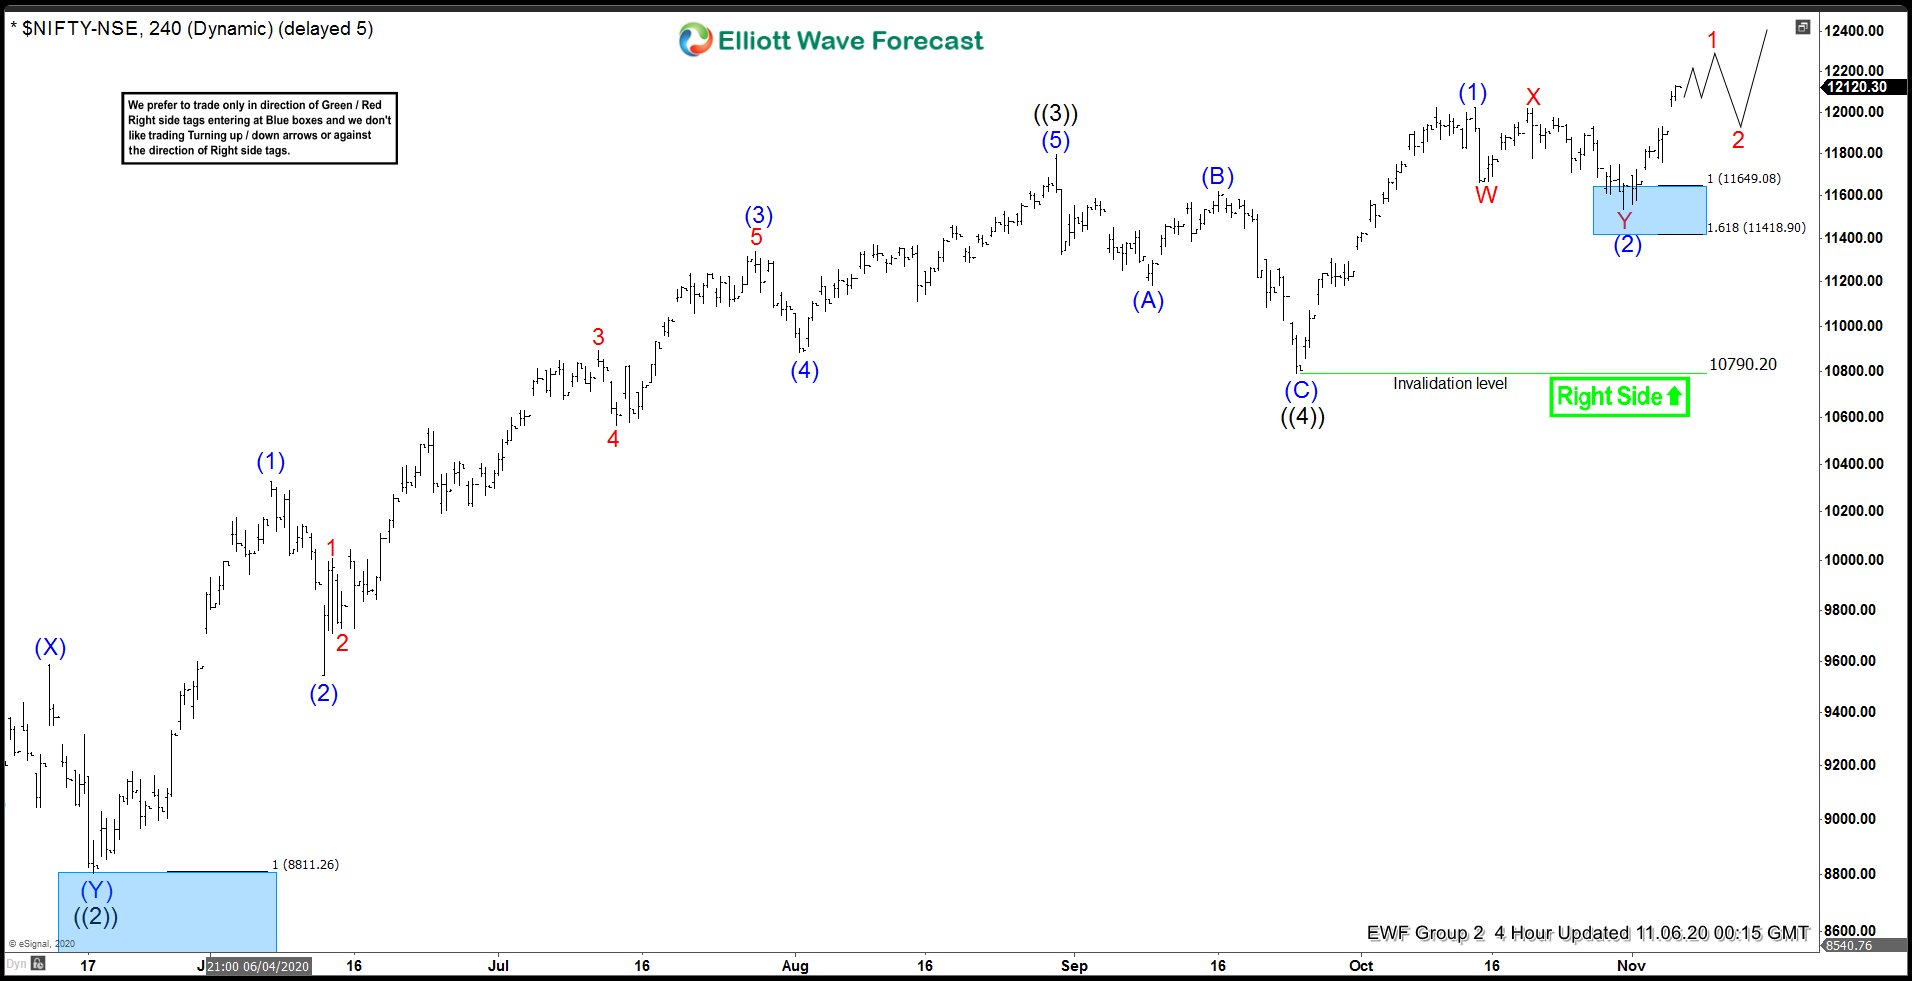
The chart above is the latest 4 Hour chart of $Nifty to members. As we were expecting, the Index reacted from the Blue Box and already trade into new highs. The new high also created a bullish sequence from the previous lows, favoring more upside.
As we have said above, we are not market makers and we do not control the market. However, we do have an understanding of the market and a forecasting system that we apply in our daily service operation. The market has performed nicely and as expected since the US General Election. We knew that the rally from the blue box can still fail and trade lower in a double zigzag. We never have control of the market, but we know where to enter the market. In the end, the market trades in technically, and the events do not matter.