Short term Elliott Wave View in AUDJPY suggests that cycle from August 31 high is unfolding as a zigzag Elliott Wave structure. On the 60 minutes chart below, we can see wave B of this zigzag ended at 76.52. Pair has resumed lower in wave C with the internal subdivision as 5 waves impulse. Pair still needs to break below the previous low on September 24 low (not shown) at 73.95 to confirm the view and avoid a double correction.
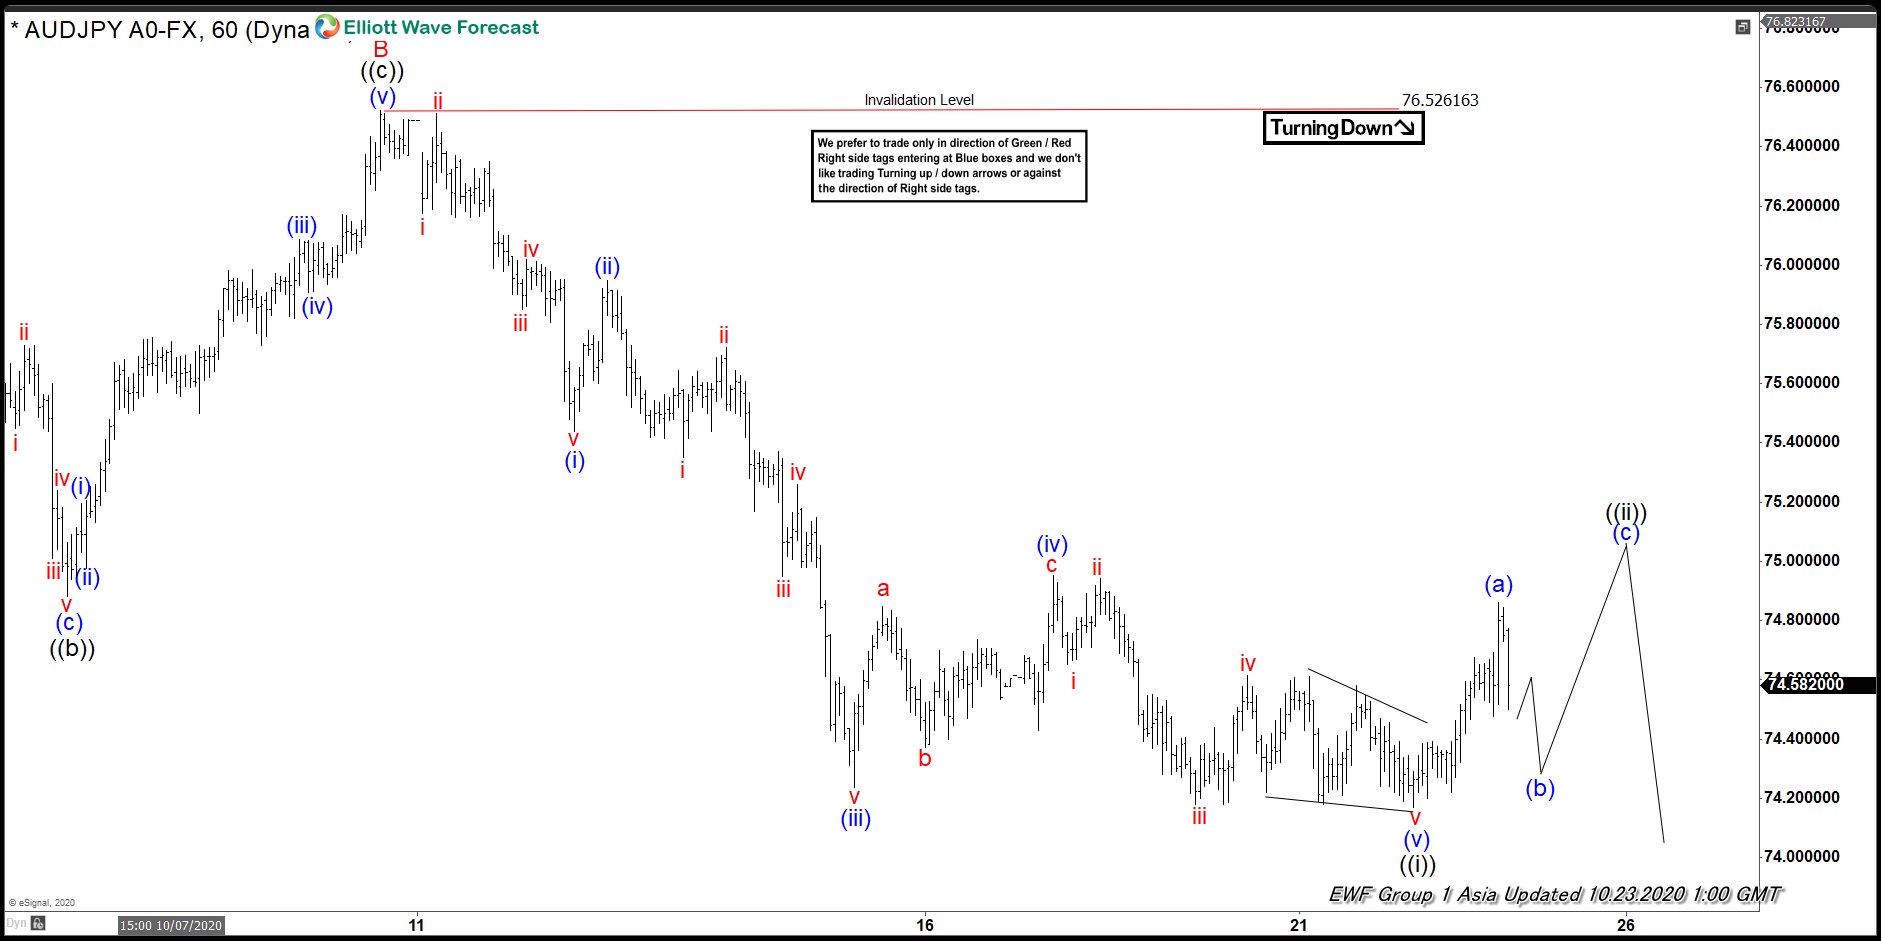
Down from wave B high at 76.52, wave (i) ended at 75.44 and bounce in wave (ii) ended at 75.94. Pair then resumed lower again in wave (iii) towards 74.23, and bounce in wave (iv) ended at 74.95. Final leg wave (v) ended at 74.17. The 5 waves move lower ended wave ((i)) of C in higher degree. Wave ((ii)) correction is currently in progress as a zigzag structure to correct cycle from October 10 high. Afterwards, expect pair to resume lower again. As far as pivot at October 10 high at 76.52 remains intact, pair should find sellers in 3, 7, or 11 swing for further weakness. Potential target lower is 100% Fibonacci extension from August 31 peak at 70.9 – 72.
AUDJPY 1 Hour Elliott Wave Chart