
COVID-19 has changed the permanently investing world, with certain sectors poised to take advantage of the pandemic for years to come. Online retail is hot and isn’t cooling down any time in the years ahead. Some select names have rallied sharply off the March 2020 lows and Wayfair is one of those names. Wayfair has managed to rally from a low of 21.70 in March 2020 to a recent high of 349.08. Is that all the stock has to give? I believe there is much more upside ahead. Lets take a look at the company profile:
“Wayfair Inc. is an American e-commerce company that sells furniture and home-goods. Formerly known as CSN Stores, the company was founded in 2002. Their digital platform offers 14 million items from more than 11,000 global suppliers. The online company is headquartered in Boston, Massachusetts,Wayfair has offices and warehouses throughout the United States as well as in Canada, Germany, Ireland, and the United Kingdom.
Wayfair operates five branded retail websites: the main Wayfair site, Joss & Main, AllModern, Birch Lane, and Perigold.“
Lets take a look at the Elliott Wave view of Wayfair below.
Wayfair Elliott Wave Weekly View
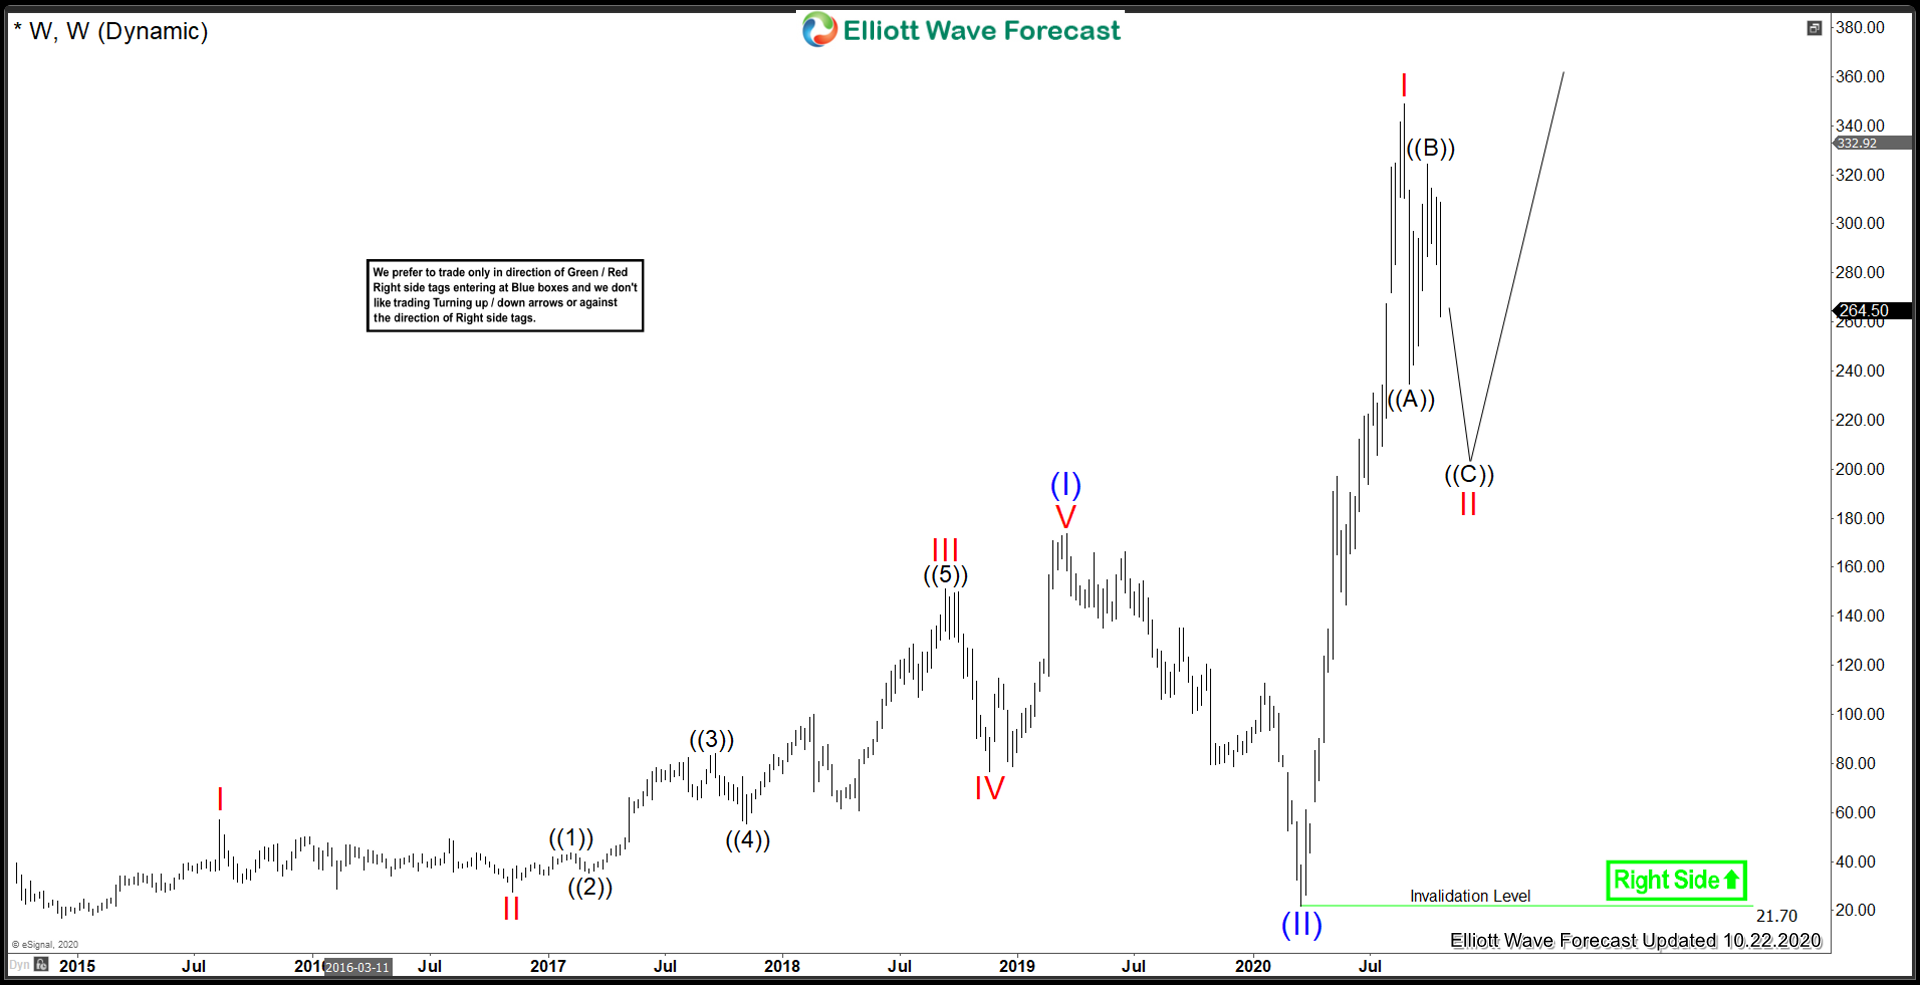
On a Weekly Time Frame. From the December 2014 lows of 16.74, Wayfair spent a few years ralling in a wave (I). With Blue (I) peaked in March 2019 at 173.72, and Blue (II) bottomed in March 16 2020 at 21.70. After that, an explosive rally has taken hold. And the price has increased from 21.70 to a peak of 349.08. Which is an increase of 1600%. It is favoured that Wayfair has recently peaked in a nesting Red I top on August 24/2020 at the 349.08 price point. It has been correcting the cycle from March 2020 low so far, and still is favoured to post one more low before resuming higher.
Lets zoom into the 4H view.
Wayfair 4H Elliott Wave View:
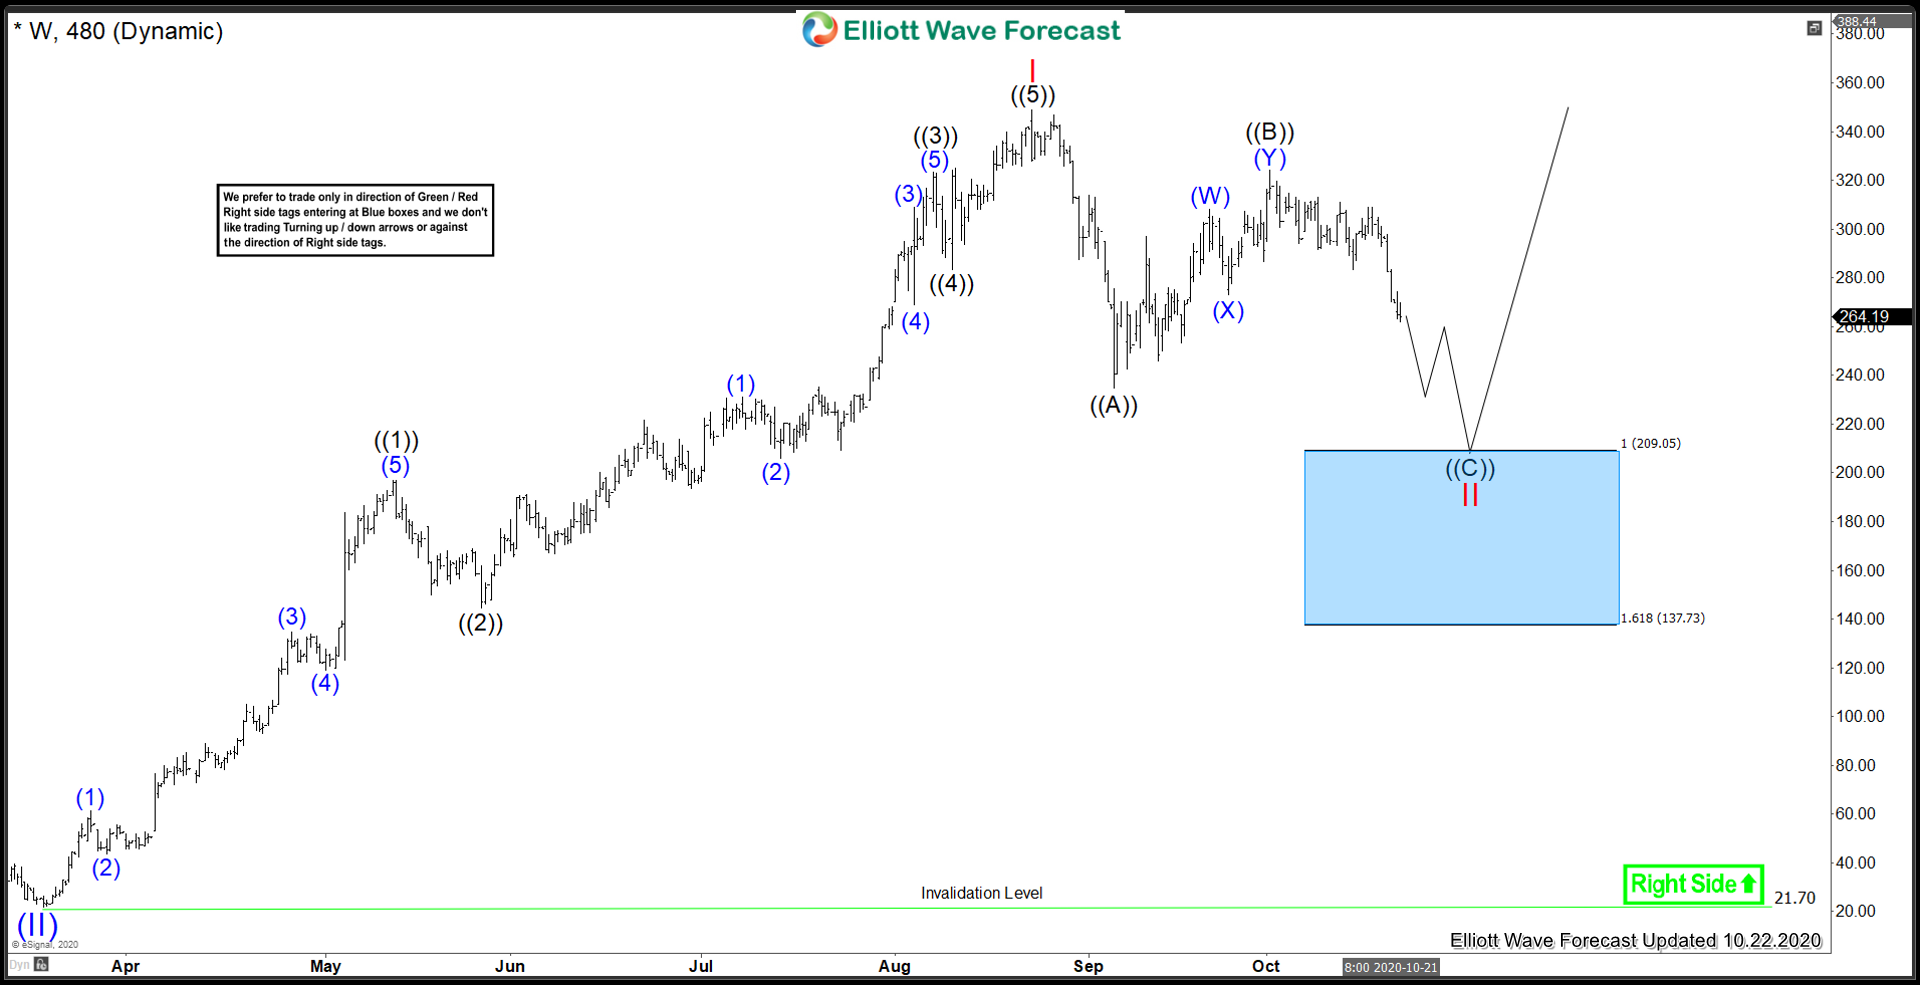
Medium term term view from 3/19/2020 lows of 21.70. There is a 5 waves impulse leading into Red I, which peaked on August 24/2020 at a price of 349.08. After that, a sharp wave down for ((A)) took place. A bounce in ((B)) is favoured set on October 1/2020 at 324.21 Presently, another leg down in ((C)) of Red II is favoured to be underway. As long as prices remain under the ((B)) high, further downside extension is likely, until the extreme area is reached.
The blue box extreme area represent an area where buyers may enter the market. A bounce can take place from that 209 – 137 area in 3 waves at least. Stops can be placed under the 137 level if going long at the blue box extreme.
In conclusion, the structure from the 2014 low on Wayfair is bullish. It has potential to break out in a multi year wave (III) rally. Patience is needed in the near term, we do not like trading the middle, we like to trade the extreme areas.