
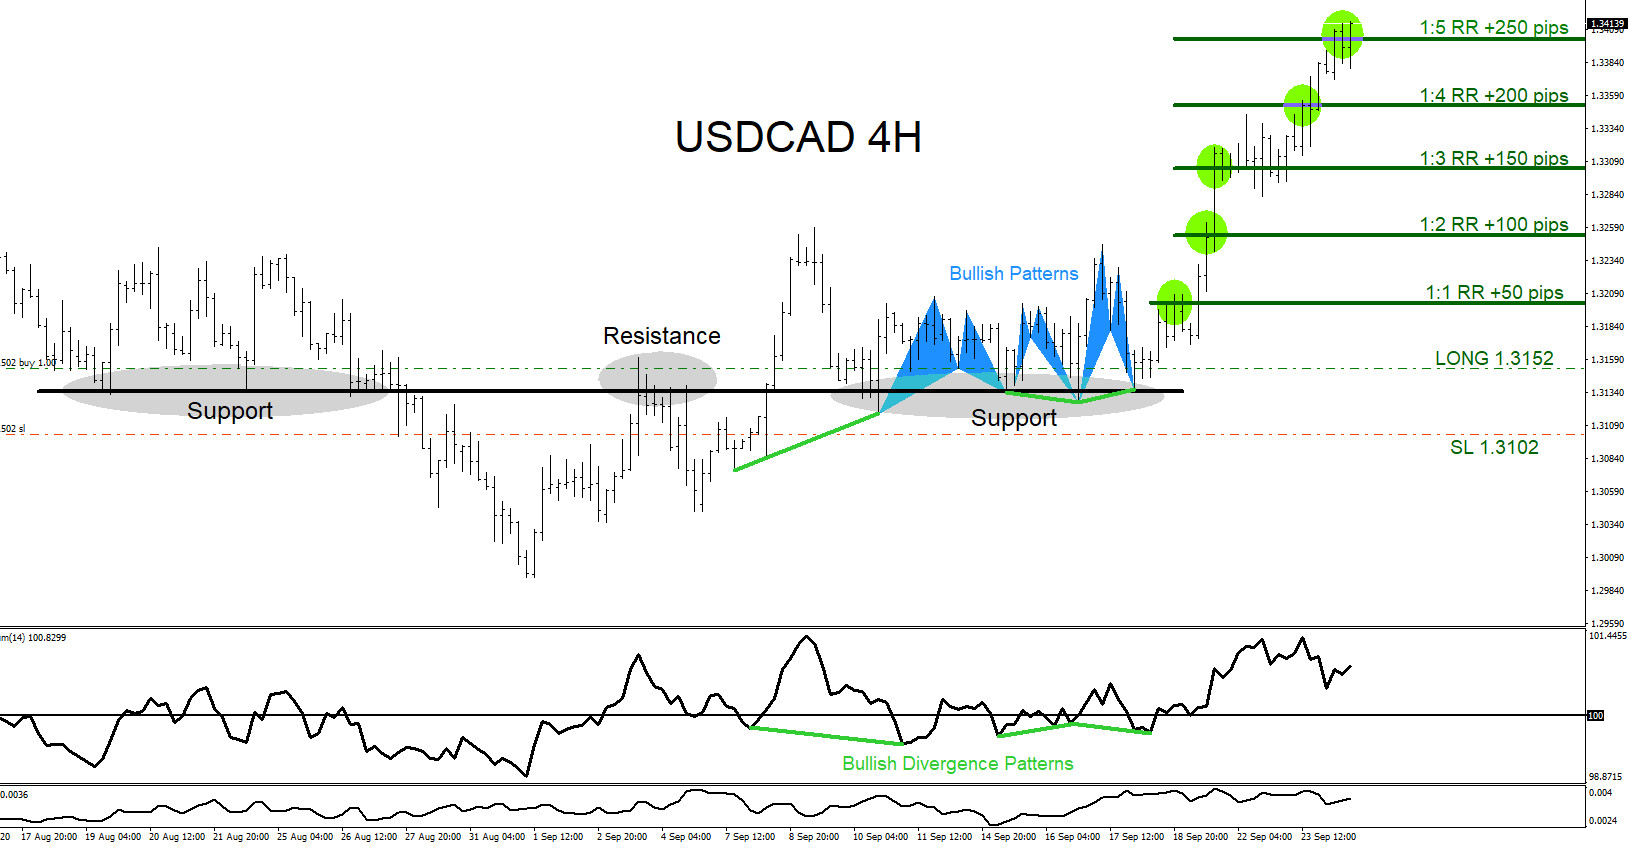
On September 17 2020 I posted on social media Stocktwits/Twitter @AidanFX “USDCAD Will be looking for BUYS as long price stays above 1.3126.” The chart below was also posted September 17 2020 showing that bullish market patterns were visible calling for a move higher. Bullish Pattern (grey) triggered BUYS with a combination of a bullish divergence pattern formation (light green) and a key support/resistance level (black). This triple bullish confirmation allowed me to call the move higher and advise traders that the pair would push higher.
USDCAD 4 Hour Chart September 17 2020

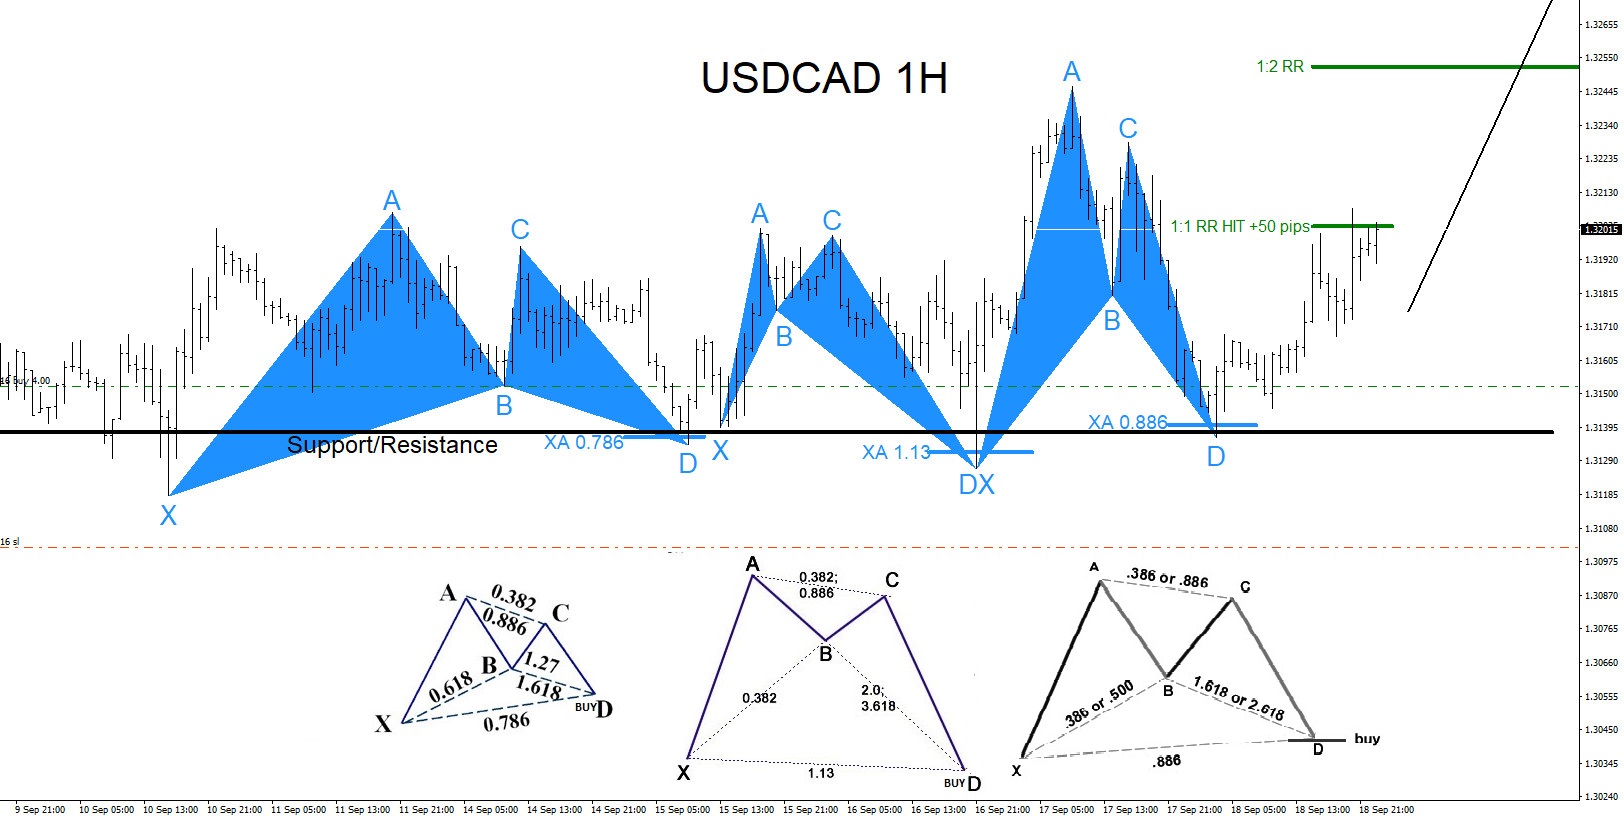
Shifting to the 1 hour chart below, USDCAD was already signalling bulls that the support/resistance (black) was a key level where price can bounce higher from. There was a couple of previous bullish patterns that also triggered BUYS near the support level. By using the support level as a key area to look for buys the final bullish pattern was easier to spot which triggered buyers at the XA 0.886% Fib. retracement level.
USDCAD 1 Hour Chart September 18 2020
USDCAD eventually rallied higher and hit the 1:5 RR BUY target at 1.3402 from 1.3152 for +250 pips. A trader should always use multiple time frame charts to look for possible trade entries and always use multiple trading strategies to confirm the trade. If you followed me on Twitter/Stocktwits @AidanFX you too could have caught the USDCAD move higher.
USDCAD 4 Hour Chart September 24 2020
Of course, like any strategy/technique, there will be times when the strategy/technique fails so proper money/risk management should always be used on every trade. Hope you enjoyed this article and follow me on Twitter for updates and questions> @AidanFX