
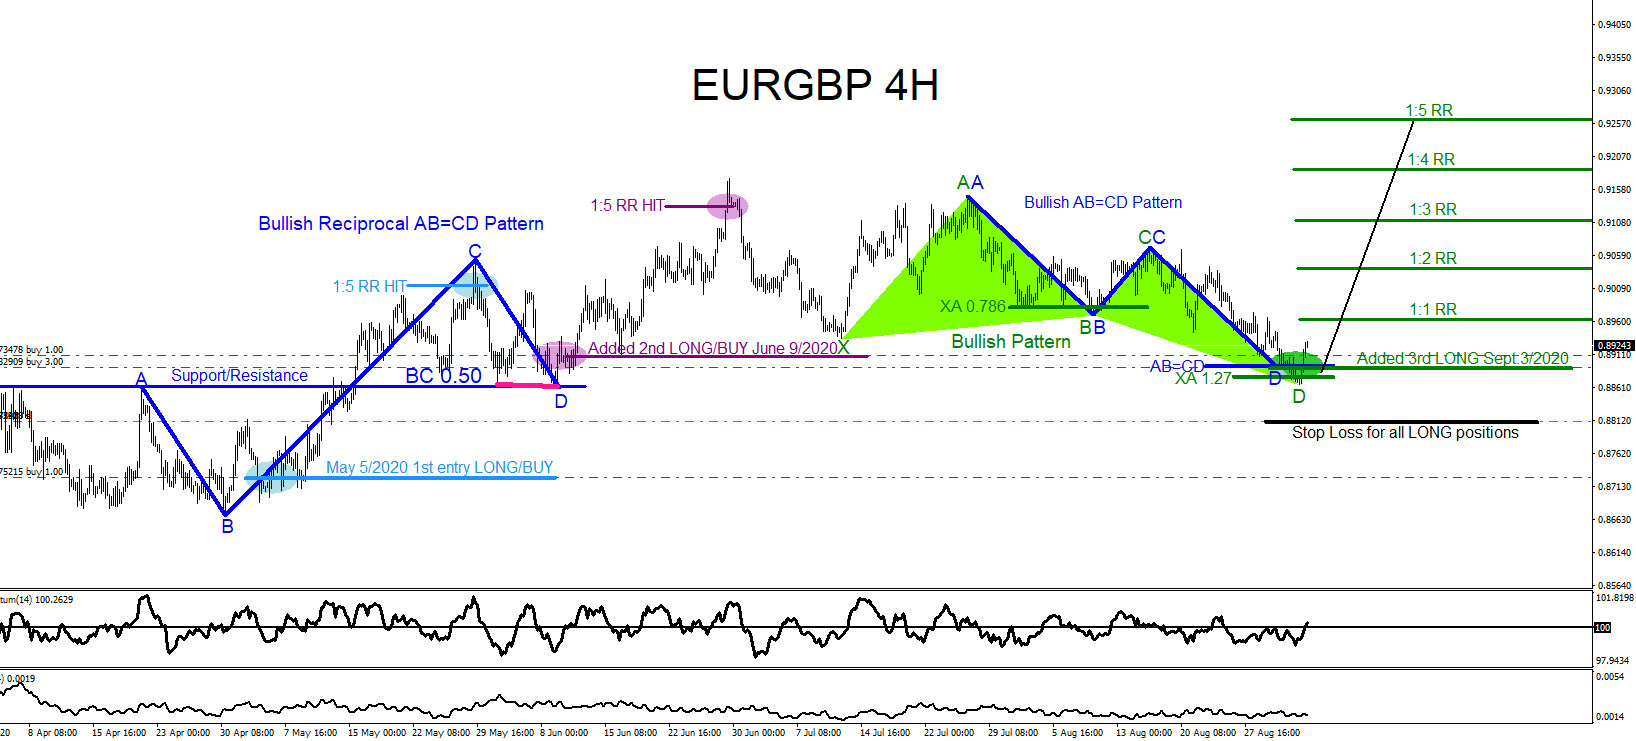
On September 3 2020 I posted on social media Stocktwits/Twitter @AidanFX “LONGSIDE EURGBP”. The chart below was also posted September 3 2020 showing that bullish market patterns were visible on the 4 hour chart calling for a move higher. Bullish Pattern (green) triggered BUYS at the XA 1.27 Fib. retracement level and the bullish AB=CD pattern (blue) triggered BUYS at the AB=CD level. I called for traders to add 3rd LONGS/BUYS at 0.8888 with stop loss for all BUY positions at 0.8808.
EURGBP 4 Hour Chart September 3 2020
EURGBP 4 Hour Chart September 11 2020
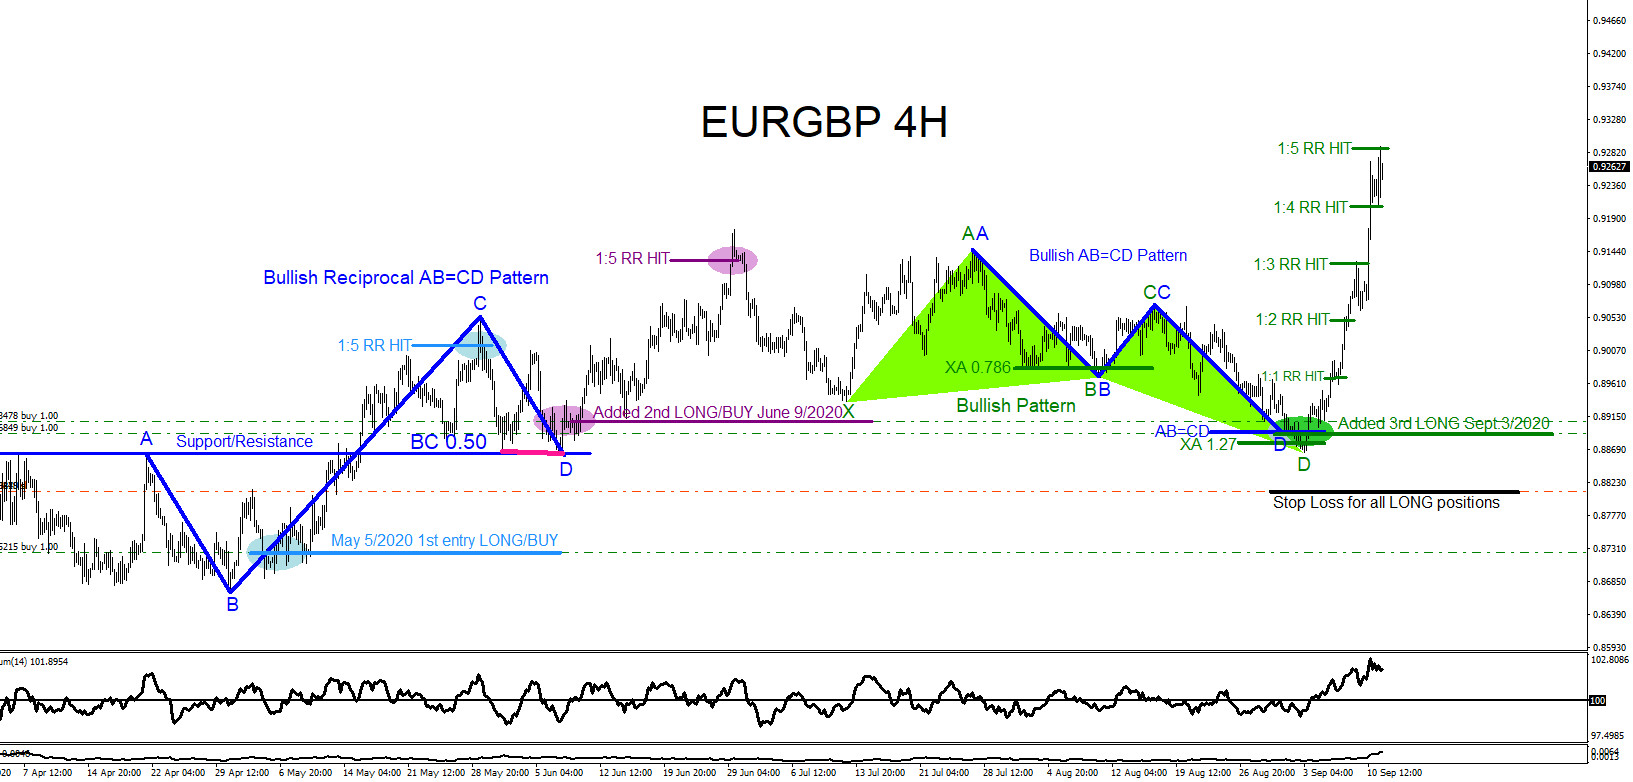
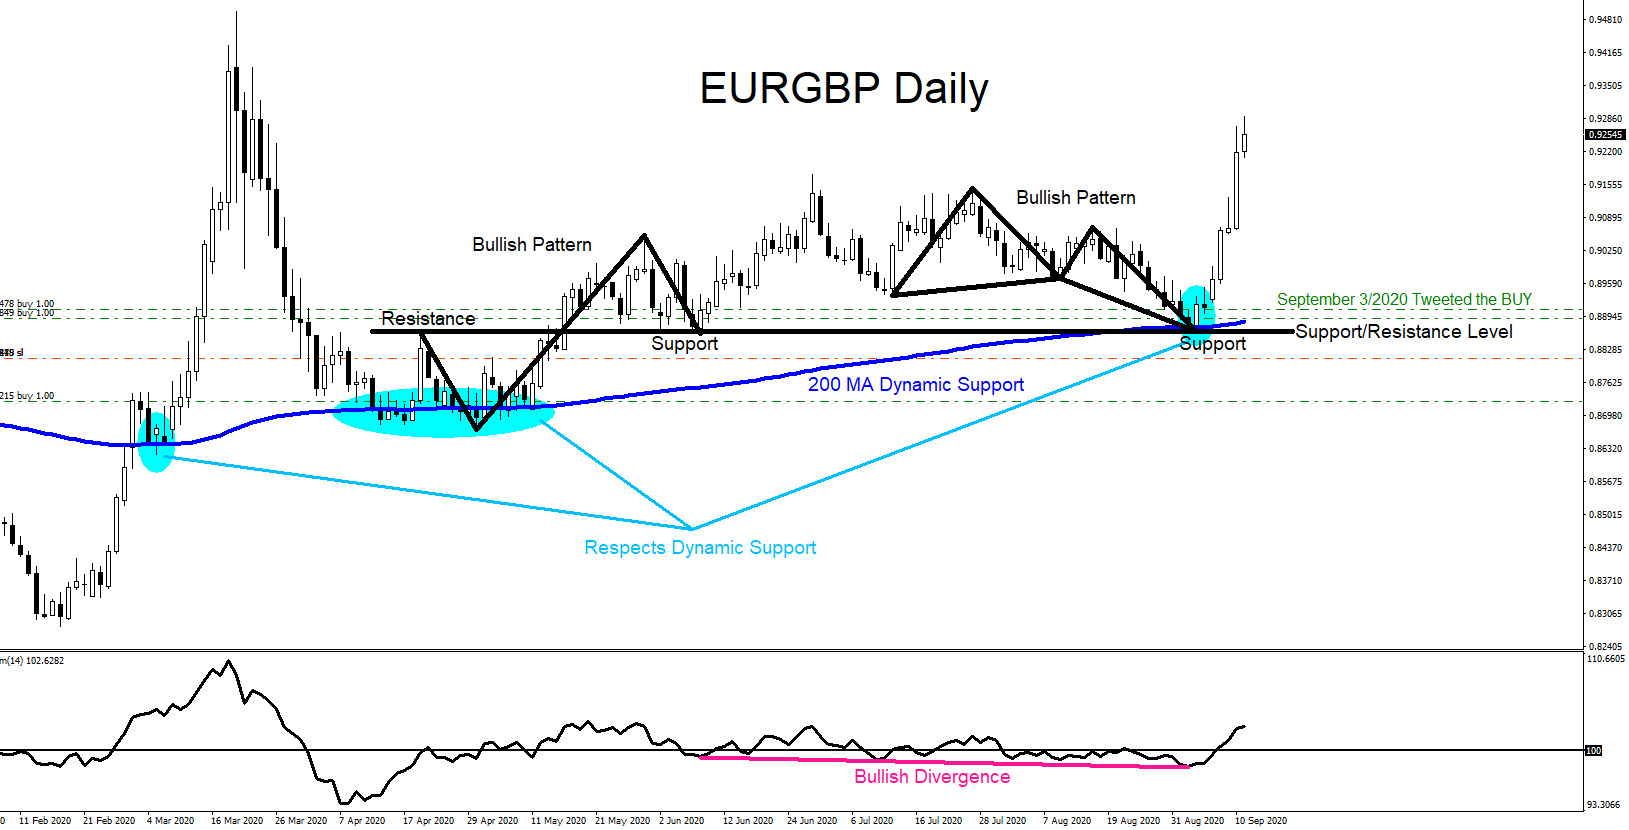
The pair rallied higher and hit the 1:5 RR 3rd BUY target at 0.9288 from 0.8888 for +400 pips. A trader should always use multiple time frame charts to look for possible trade entries. The EURGBP Daily chart below also displayed added bullish patterns signalling that the pair could move higher. On the Daily chart, the 4 hour bullish green pattern and blue AB=CD pattern triggered BUYS near the support/resistance level (black) and the Dynamic Support 200MA (blue) also converged in the same BUY area. What was clearly visible, on the Daily chart, was that price was respecting the 200MA Dynamic Support and repeatedly bounced higher from it adding more reasons to add the 3rd BUY entry. If you followed me on Twitter/Stocktwits @AidanFX you too could have caught the EURGBP move higher.
Of course, like any strategy/technique, there will be times when the strategy/technique fails so proper money/risk management should always be used on every trade. Hope you enjoyed this article and follow me on Twitter for updates and questions> @AidanFX or chat me on Skype > EWF Aidan Chan