NZDUSD Technical Analysis September 9/2020
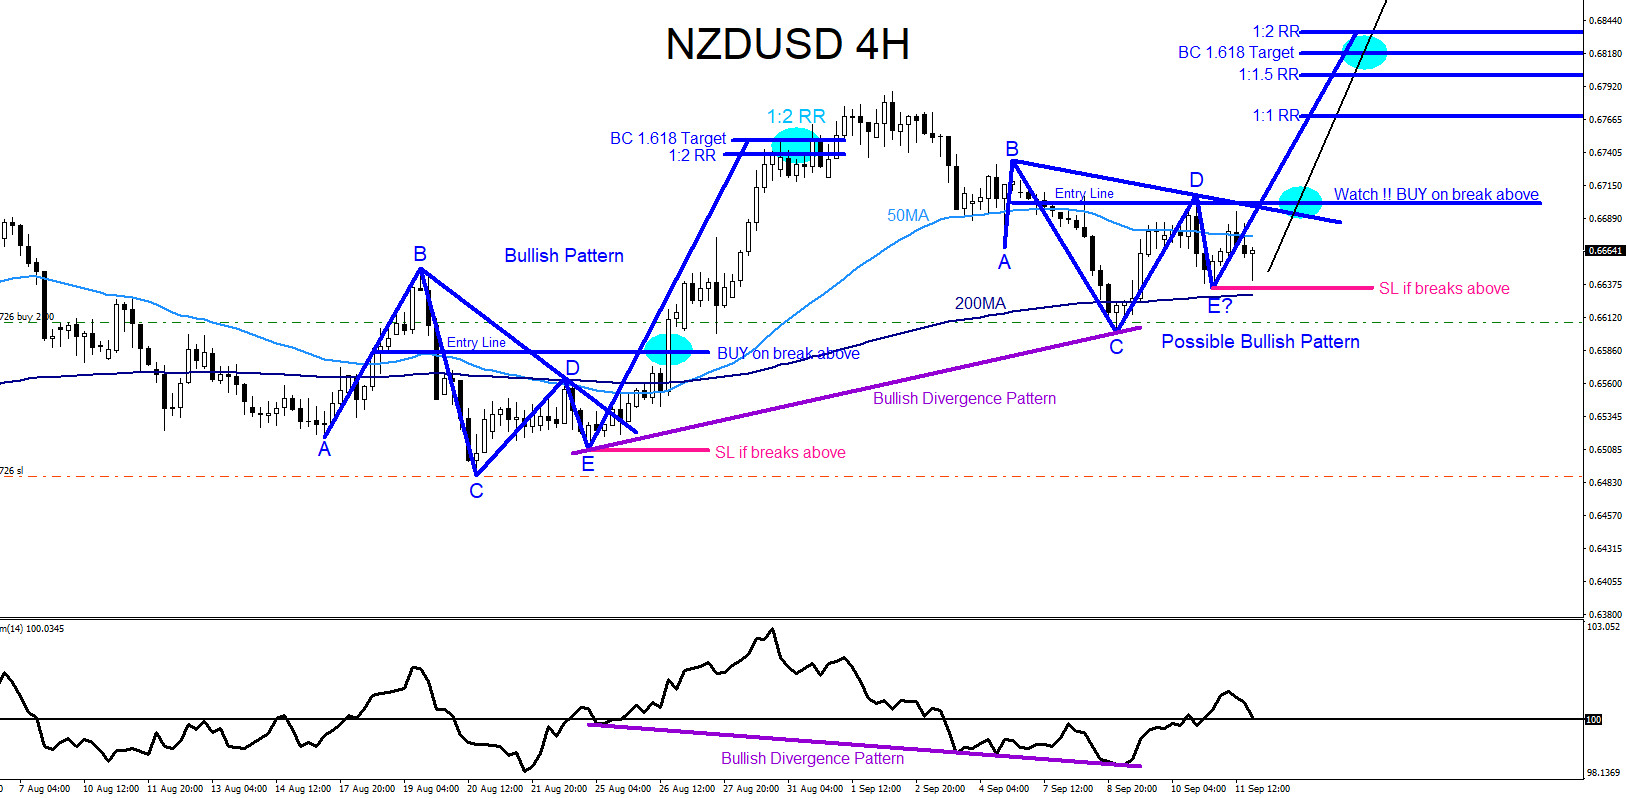
NZDUSD remains bullish as long as the August 20/2020 0.6488 low remains untouched. In this analysis of the NZDUSD pair, market patterns will be used to determine possible trade entries. In the chart below, there is a possible bullish pattern that can trigger BUYS for another push higher. Possible blue bullish pattern triggers BUYS on the break above the entry line. Traders still need to be patient and wait to see if point E holds. If point E holds and price reverses higher then watch for the entry breakout level. Rule for this pattern is price needs to trigger buy signals above the 50MA and 200MA and if sell signals below the 2 moving averages. A bullish divergence pattern (purple) has already formed which adds more sentiment that the pair can break higher. Traders will need to wait and watch if point E holds or moves lower. As long as point E terminates above point C the bullish pattern remains valid. Only a move below the point C invalidates the possible bullish pattern. If looking to trade NZDUSD stops should be placed at the point E low looking for targets at the BC 1.618 Fib. level area. Only time will tell what NZDUSD will do but at least now you know how to trade the pair if it rallies higher.
NZDUSD 4 Hour Chart September 12/2020
Of course, like any strategy/technique, there will be times when the strategy/technique fails so proper money/risk management should always be used on every trade. Hope you enjoyed this article and follow me on Twitter for updates and questions> @AidanFX or chat me on Skype > EWF Aidan Chan