
Hello fellow traders. Another instrument that we have been trading lately is INDU. In this technical blog we’re going to take a quick look at the Elliott Wave charts of $INDU , published in members area of the website. As our members know, INDU is showing higher high sequences in the cycle from the March low which makes it bullish against the 24418 low. Short term cycle from the 24418 low also shows higher high sequences, calling for further rally. Consequently, we advised members to avoid selling $INDU and keep on buying the dips in the sequences of 3,7,or 11 swings whenever get chance. In further text we’re going to explain Elliott Wave Forecast and Trading strategy.
INDU 1 Hour Elliott Wave Analysis 8.19.2020
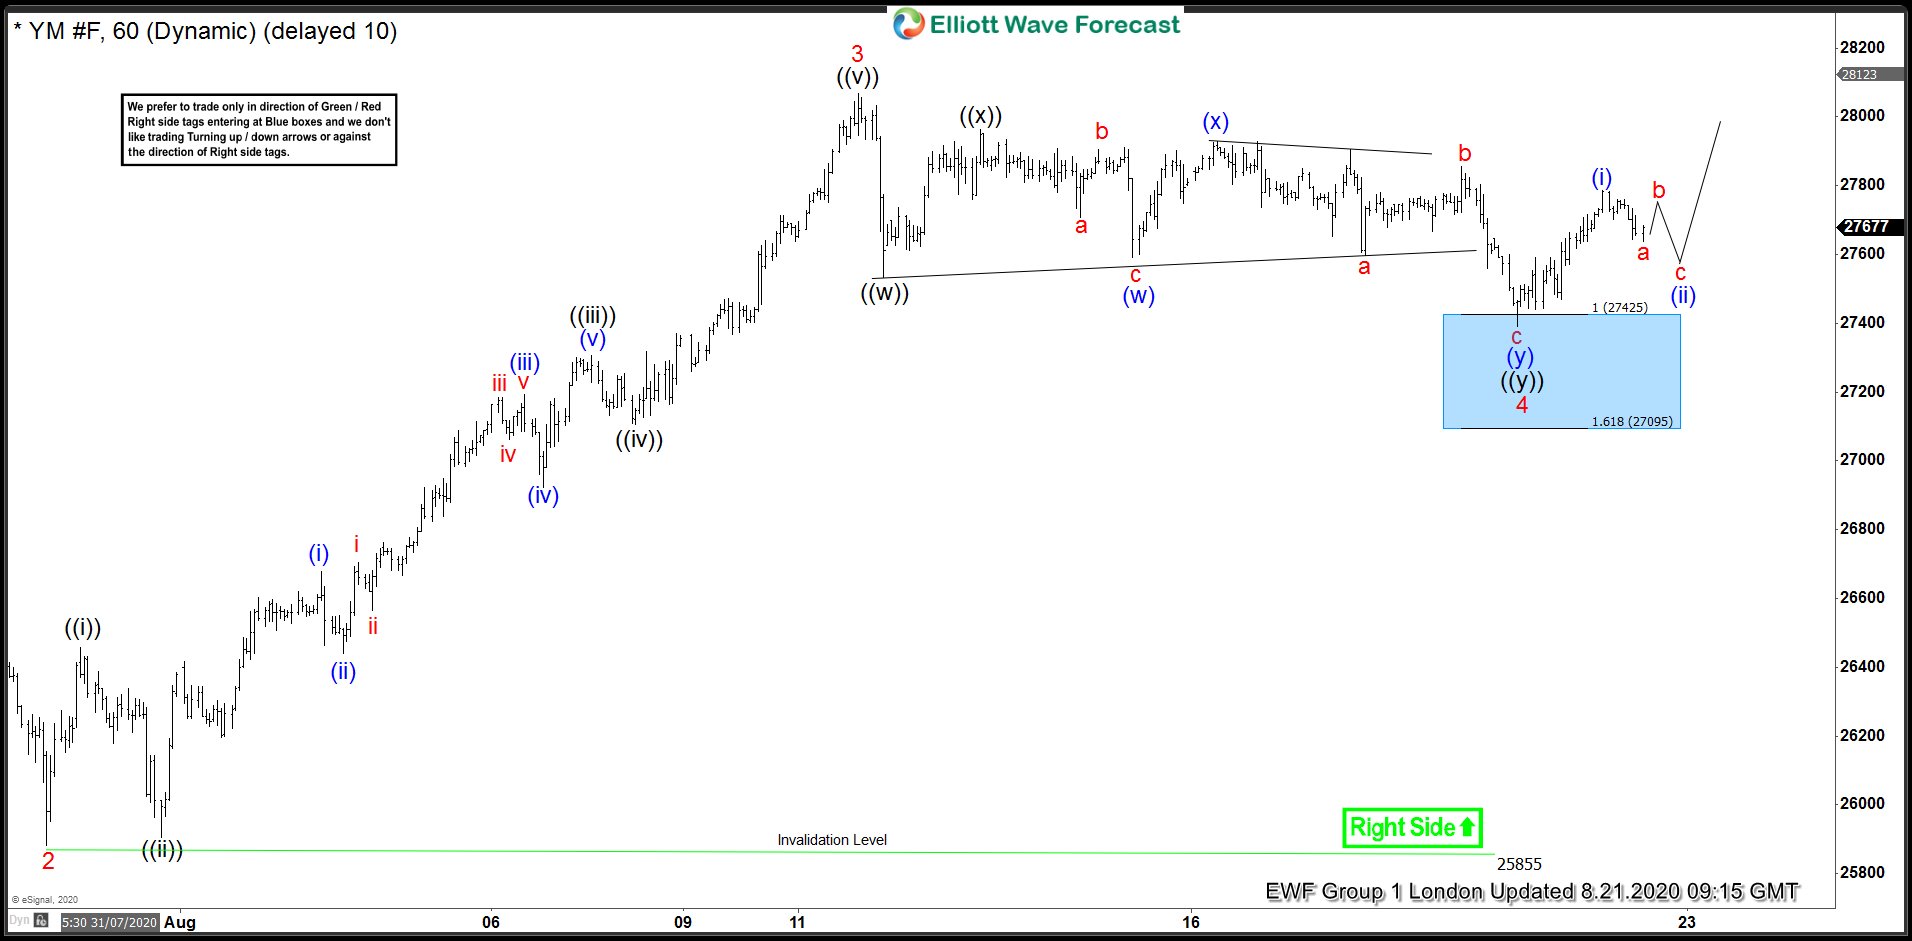
INDU is giving us pull back wave 4 red that is correcting cycle from the 25887 low. Pull back looks incomplete at this stage. We expect to see another leg down toward 27425-27094 ( buyers zone) . From marked Blue Box area area we expect rally to take us toward new highs ideally. As our members know Blue Boxes are no enemy areas , giving us 85% chance to get a bounce. We don’t recommend selling it against the main trend. Strategy is buying the dips at the marked blue box area. As the main trend is bullish, we expect to see 3 waves bounce at least from the mentioned zone. As soon as the price reach 50 Fibonacci Retracement against the (x) blue peak, we should make long positions Risk Free ( put SL at BE).

INDU 1 Hour Elliott Wave Analysis 8.21.2020
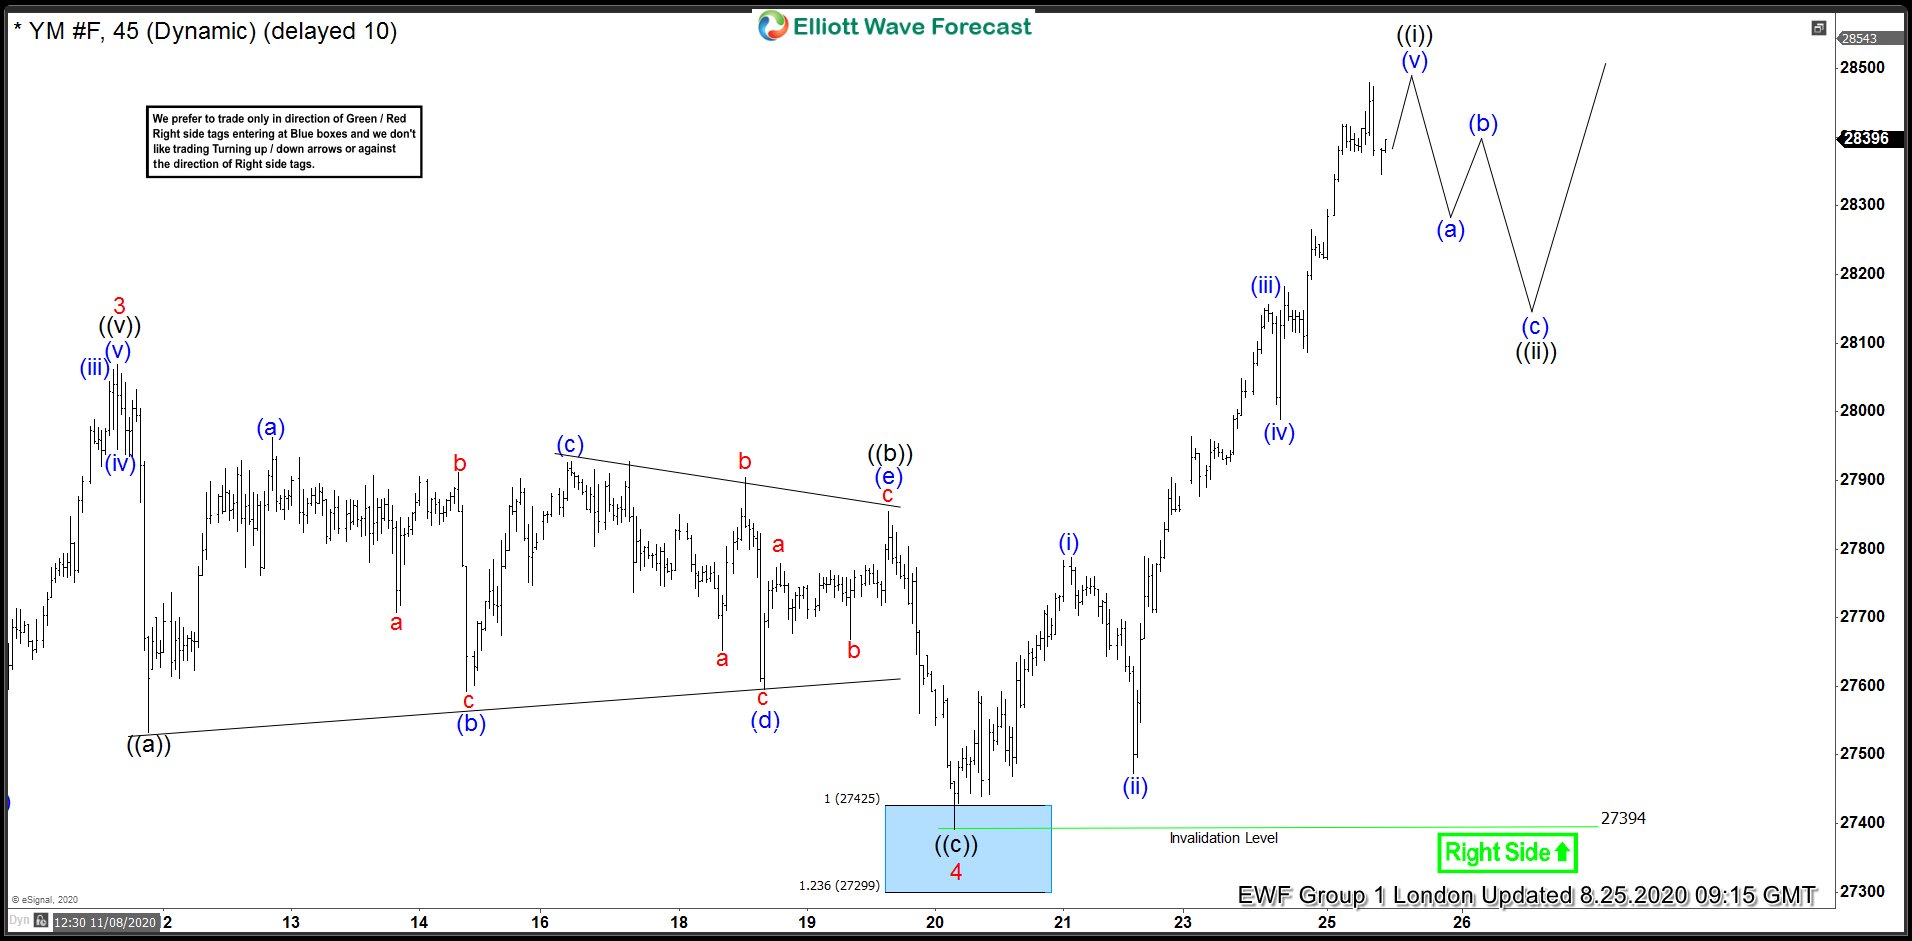
Eventually we got another leg down toward blue box area. INDU found buyers and giving us nice reaction when wave 4 red pull back ended at the 27395 low. Current bounce has already reached 50 fibs against the middle pivot, so all longs should be risk free at this stage. We don’t recommend selling INDU in any proposed pull back and favor the long side from the blue box.
INDU 1 Hour Elliott Wave Analysis 8.25.2020
27394 low held nicely during the short term pull back and we got further rally. INDU broke 08/11 peak confirming next leg up is in progress. Cycle from the 27394 is about to complete as 5 waves structure. We expect to get pull back that should find buyers again for further rally.
Keep in mind market is dynamic and presented view could have changed in the mean time. You can check most recent charts in the membership area of the site. Best instruments to trade are those having incomplete bullish or bearish swings sequences.We put them in Sequence Report and best among them are shown in the Live Trading Room
Elliott Wave Forecast