
In this blog, we are going to take a look at the Elliott Wave chart of Facebook (FB). The 30 minutes pre-market chart from August 4, 2020 shows that the stock has rallied higher from wave (2) low at 226.92. That pullback in wave (2) reached the blue box area, which is an area where we expect buyers to appear. The stock resumed higher from there and broke above July 13 high. The stock is now showing a bullish sequence against June 29 low.
Facebook 8.4.2020 30 Minutes Pre-Market Elliott Wave Chart
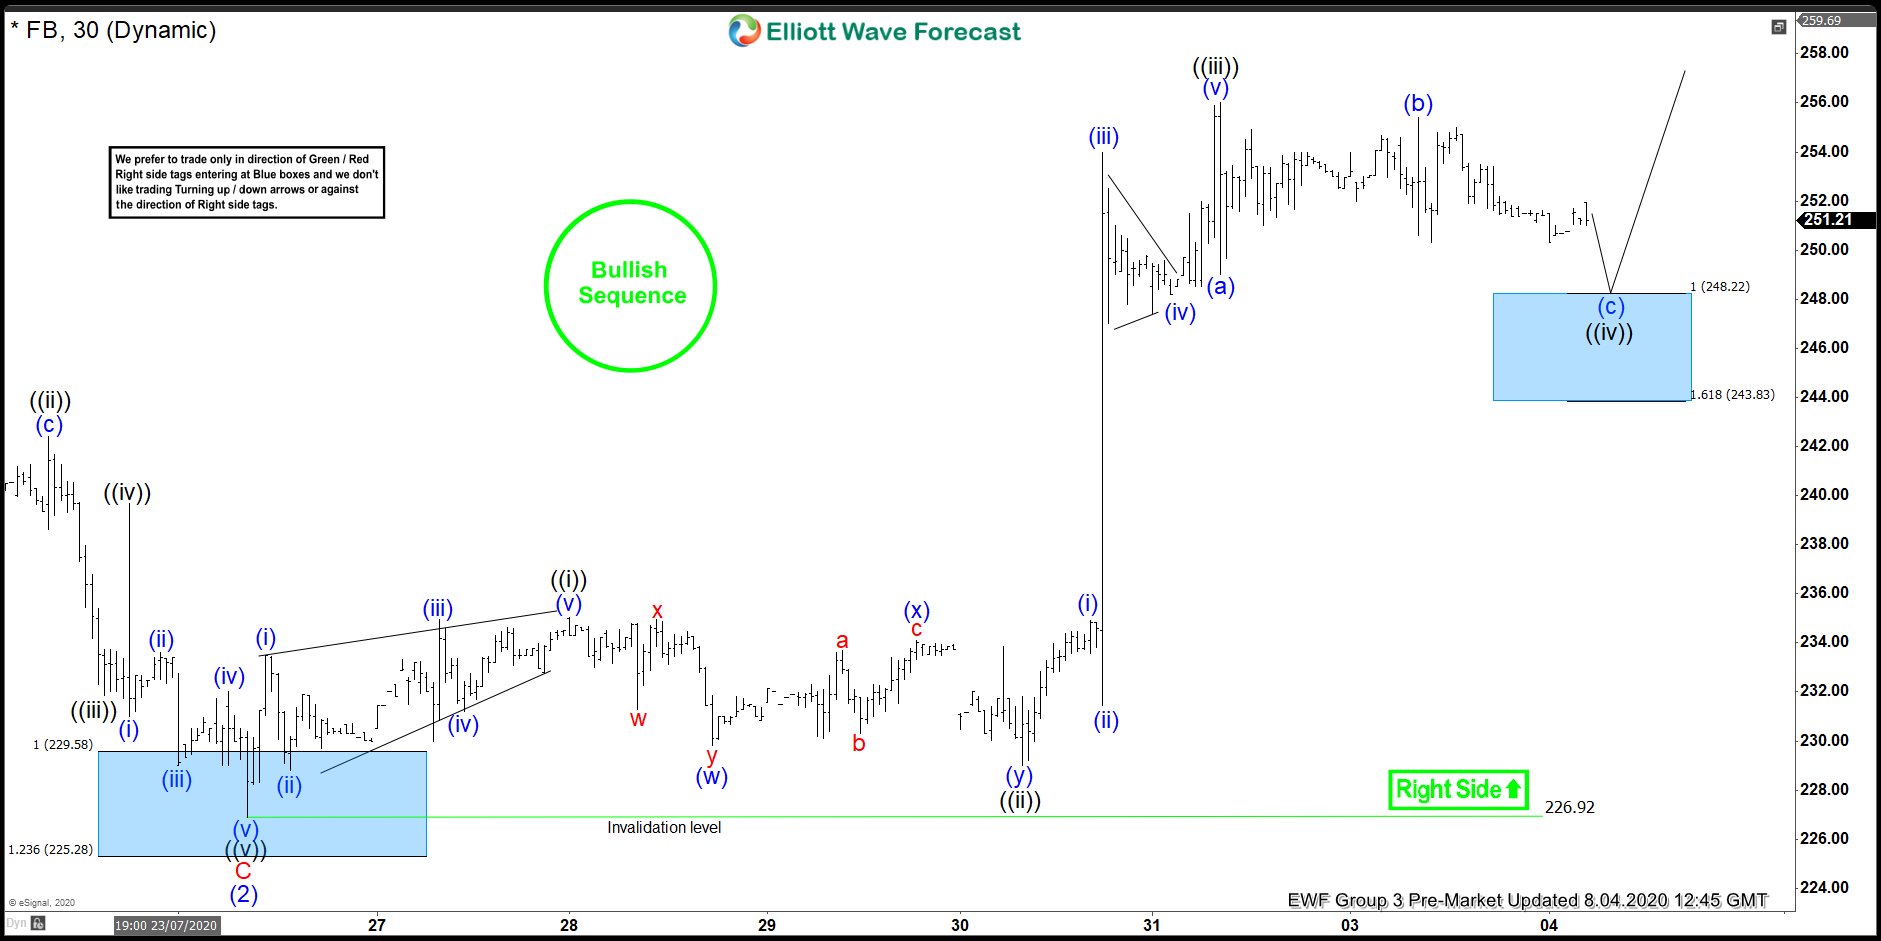
Up from wave (2) low, the stock ended wave ((i)) at 235.05 high. The pullback in wave ((ii)) ended at 229 low. Afterwards, the stock extended higher in wave ((iii)), which ended at 256 high. The stock is then expected to do a pullback in wave ((iv)). The dip unfolded as a zig-zag Elliott Wave structure. The 100-161.8% extension of (a)-(b) where (c) is expected to end is between 243.83-248.22 area. This area is highlighted with another blue box, where the stock can see 3 waves bounce at least if reached.
Facebook 8.6.2020 30 Minutes Post-Market Elliott Wave Chart
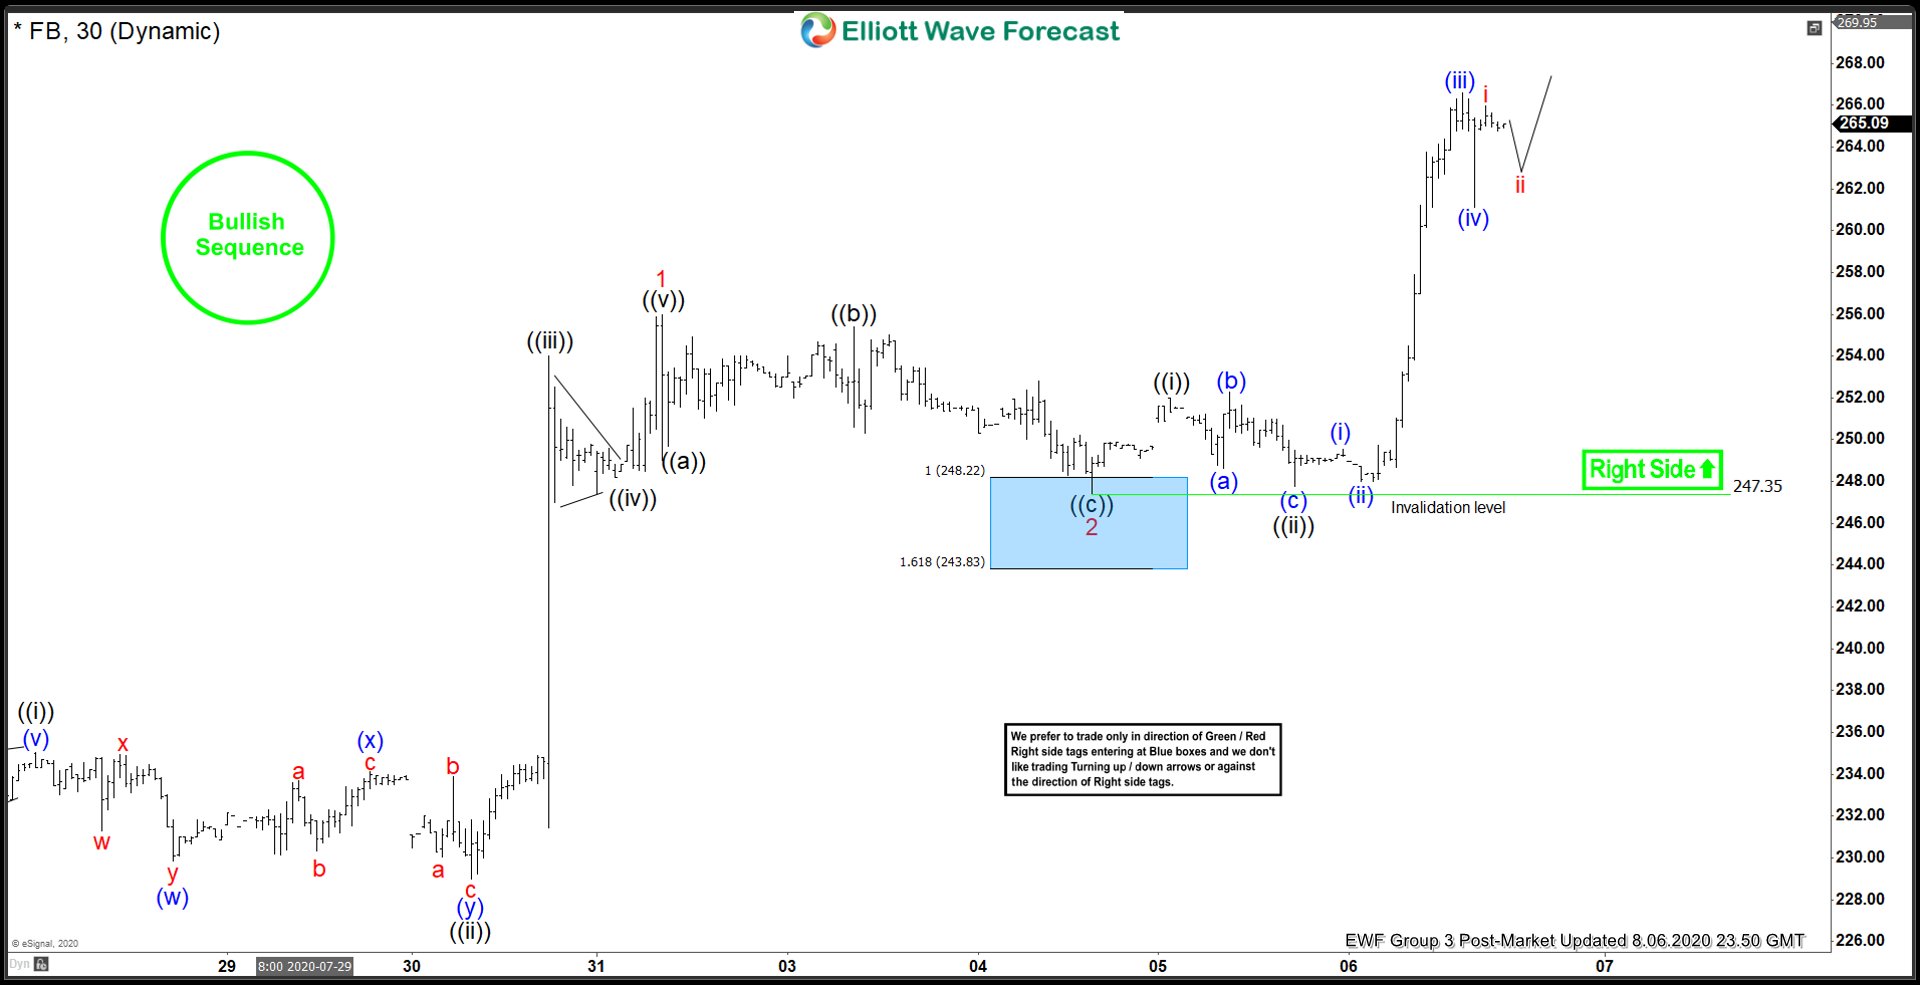
The 30 minutes chart from August 6 shows that there is a small adjustment to the count. The rally higher is now called complete as wave 1 and the pullback is proposed to be in wave 2. Nonetheless, the stock reached the proposed blue box area and ended wave 2 at 247.35, which is within the blue box area. That area saw buyers appear and pushed the stock higher, breaking the previous wave 1 high. This confirms that wave 2 is already in place and the next leg higher is wave 3 is already in progress.
Facebook 8.9.2020 30 Minutes Weekend Elliott Wave Chart
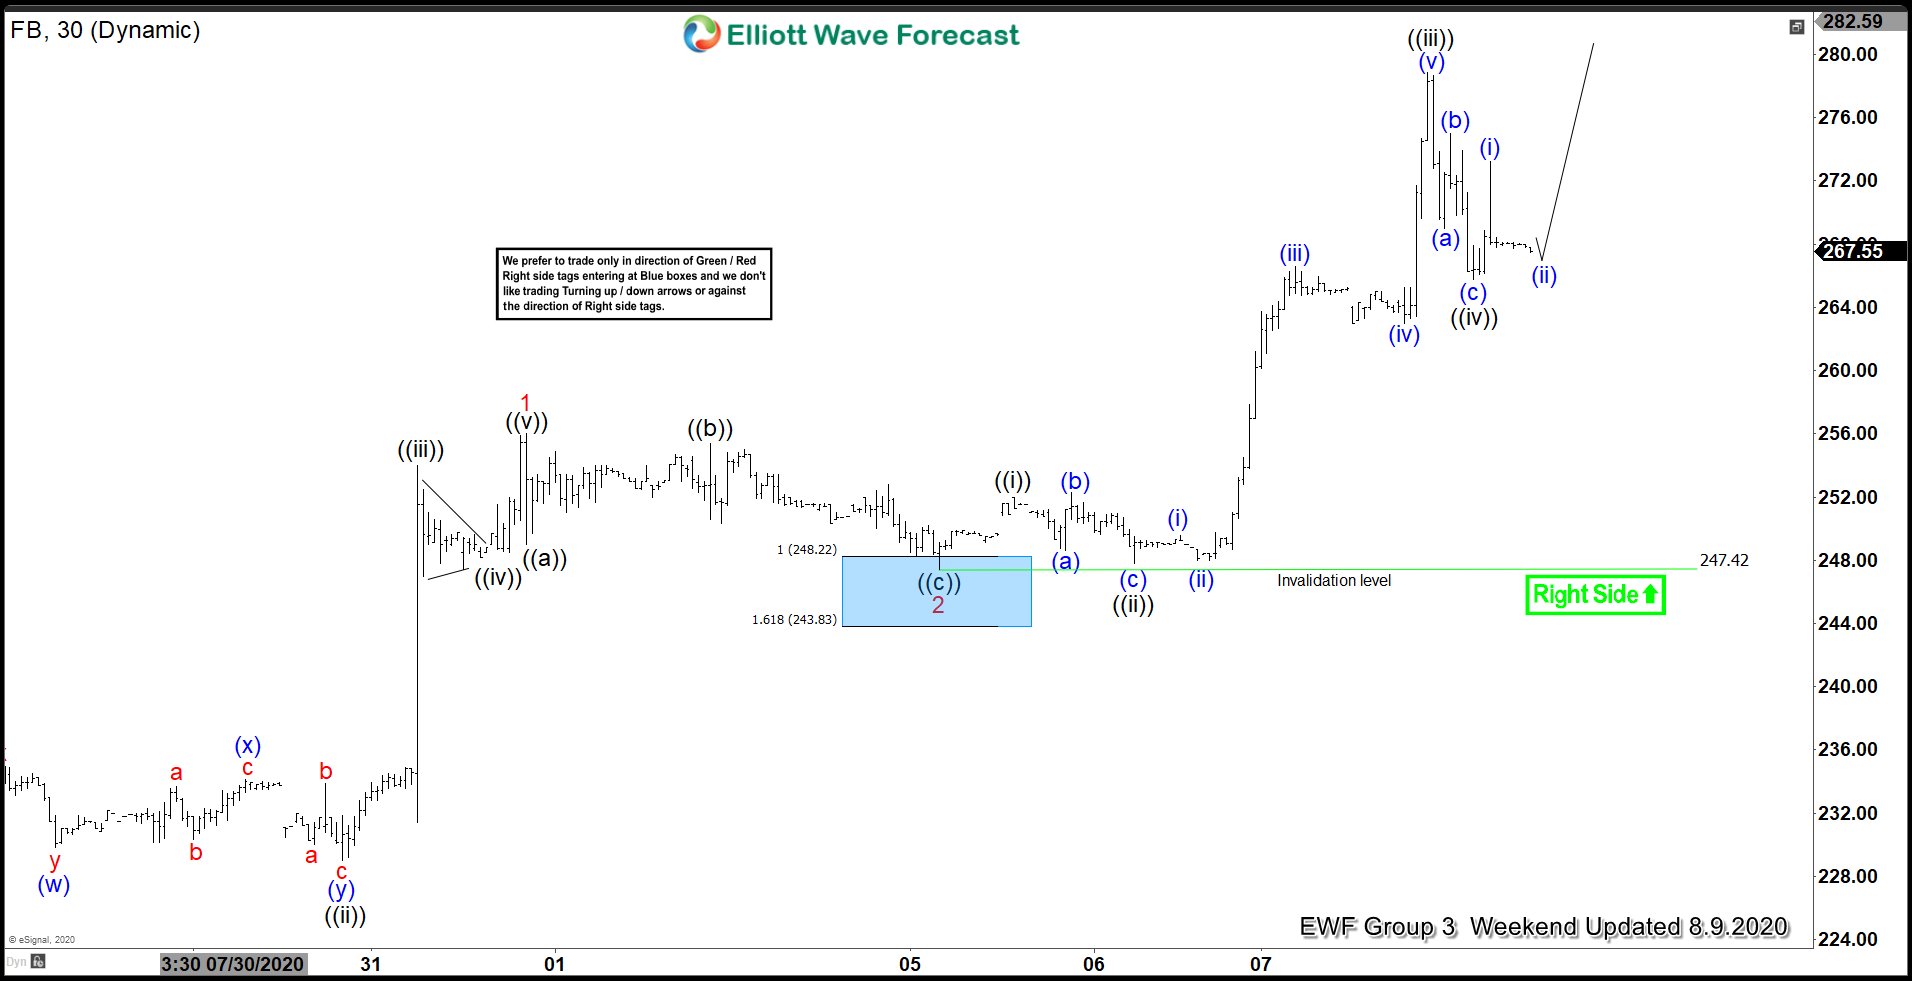
The weekend chart from August 9 shows that the stock has ended the rally higher in wave ((iii)) at 278.89 high. The pullback in wave ((iv)) then followed and ended at 265.77 low. While above 247.42 low, the stock can see more upside. However, Facebook needs to break above previous wave ((iii)) high to confirm that the next leg higher has started. Otherwise, the stock can still do 7 swing correction in wave ((iv)) before resuming higher again.