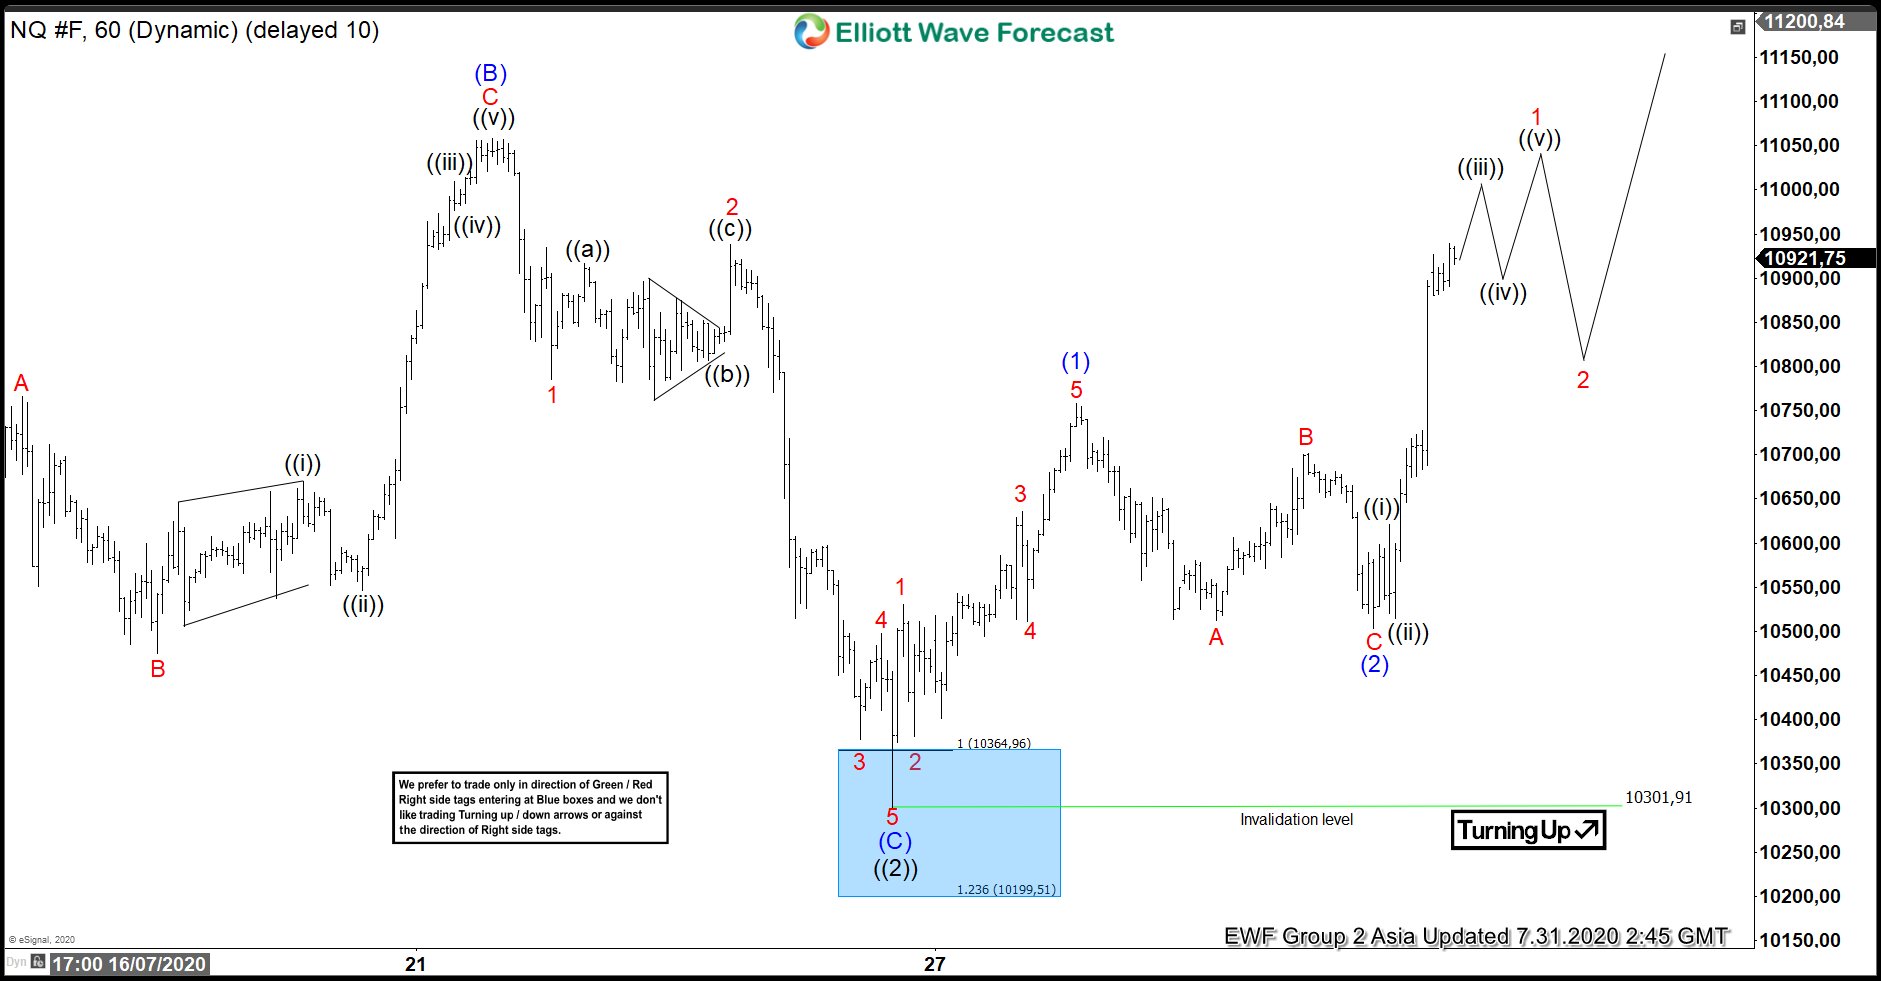
Nasdaq (NQ_F) 1 hour chart below shows that the Index has ended the correction from July 13 all-time high. The pullback unfolded as a flat Elliott Wave Structure. From July 13 high, wave (A) ended at 10358.75 low. The bounce in wave (B) ended at 11058 high. The Index then extended lower in wave (C), which ended at 10301.91 low. This completed wave ((2)) in larger degree. The correction reached the blue box area, which is the 100 – 123.6% extension of wave (A)-(B). From that blue box, the Index has turned higher. This allows buyers at blue box a risk free position.
Up from wave ((2)) low, the Index rallied higher in wave (1). The subdivision unfolded as a diagonal Elliott Wave Structure. Wave 1 ended at 10531 high and the pullback in wave 2 ended at 10381.25 low. Afterwards, the Index resumed higher in wave 3, which ended at 10635.75 high. Wave 4 dips then ended at 10511.50 low. The final push higher in wave 5 ended at 10758.50 high. Afterwards, the Index did a pullback in wave (2), which ended at 10502.75 low. The Index has resumed higher and has broken above previous wave (1) high, confirming that the next leg higher in wave (3) has started. As long as 10301.91 low stays intact, the dips in 3,7 or 11 swings is expected to find support for more upside. However, the Index still needs to break above July 13 peak in order to avoid doing a double zig-zag correction.
NASDAQ (NQ_F) 1 Hour Elliott Wave Chart