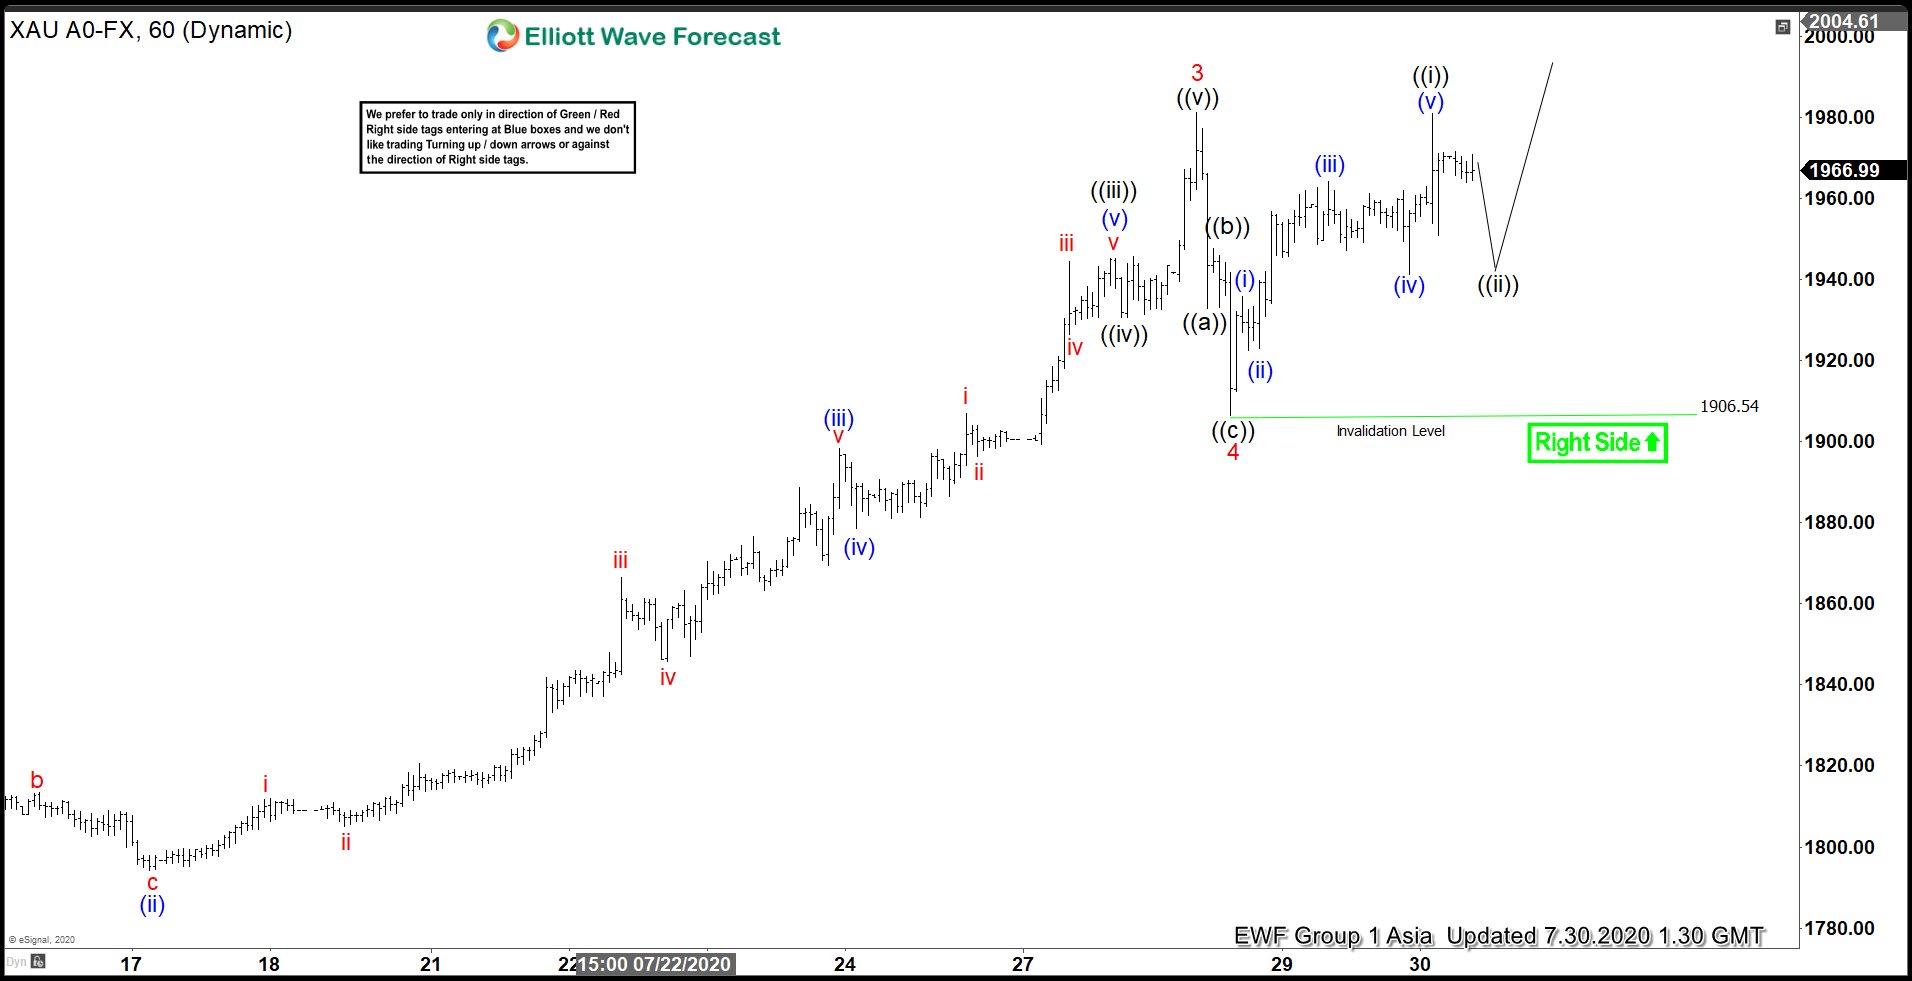
Gold 1 hour chart below shows that the metal has ended the cycle from July 6 low in wave 3 at 1981.20 high. The metal has now broken to new all-time high above September 2011 high. The rally from July 6 low unfolded as a 5 waves impulsive Elliott Wave Structure. Up from July 6 low, wave ((i)) ended at 1818.14 high and the dip in wave ((ii)) ended at 1789.87 low. From there, the metal then continued higher and ended wave ((iii)) at 1945.25 high. The pullback in wave ((iv)) ended at 1930.50 low. The metal then extended higher in wave ((v)), which ended at 1981.20 high. This ended wave 3 in larger degree.
Afterwards, the metal did a pullback in wave 4, which unfolded as a zig-zag correction. Wave 4 dip ended at 1906.54 low. Up from that low, the metal has resumed higher as another 5 waves impulse in wave ((i)). The rally higher ended at 1980.84 high. Currently, wave ((ii)) is in progress. While above 1906.54 low, expect dips in 3,7 or 11 swings to find support for more upside later. However, gold needs to break above wave 3 high at 1981.20 to confirm that next leg higher has started.
Gold (XAUUSD) 1 Hour Elliott Wave Chart