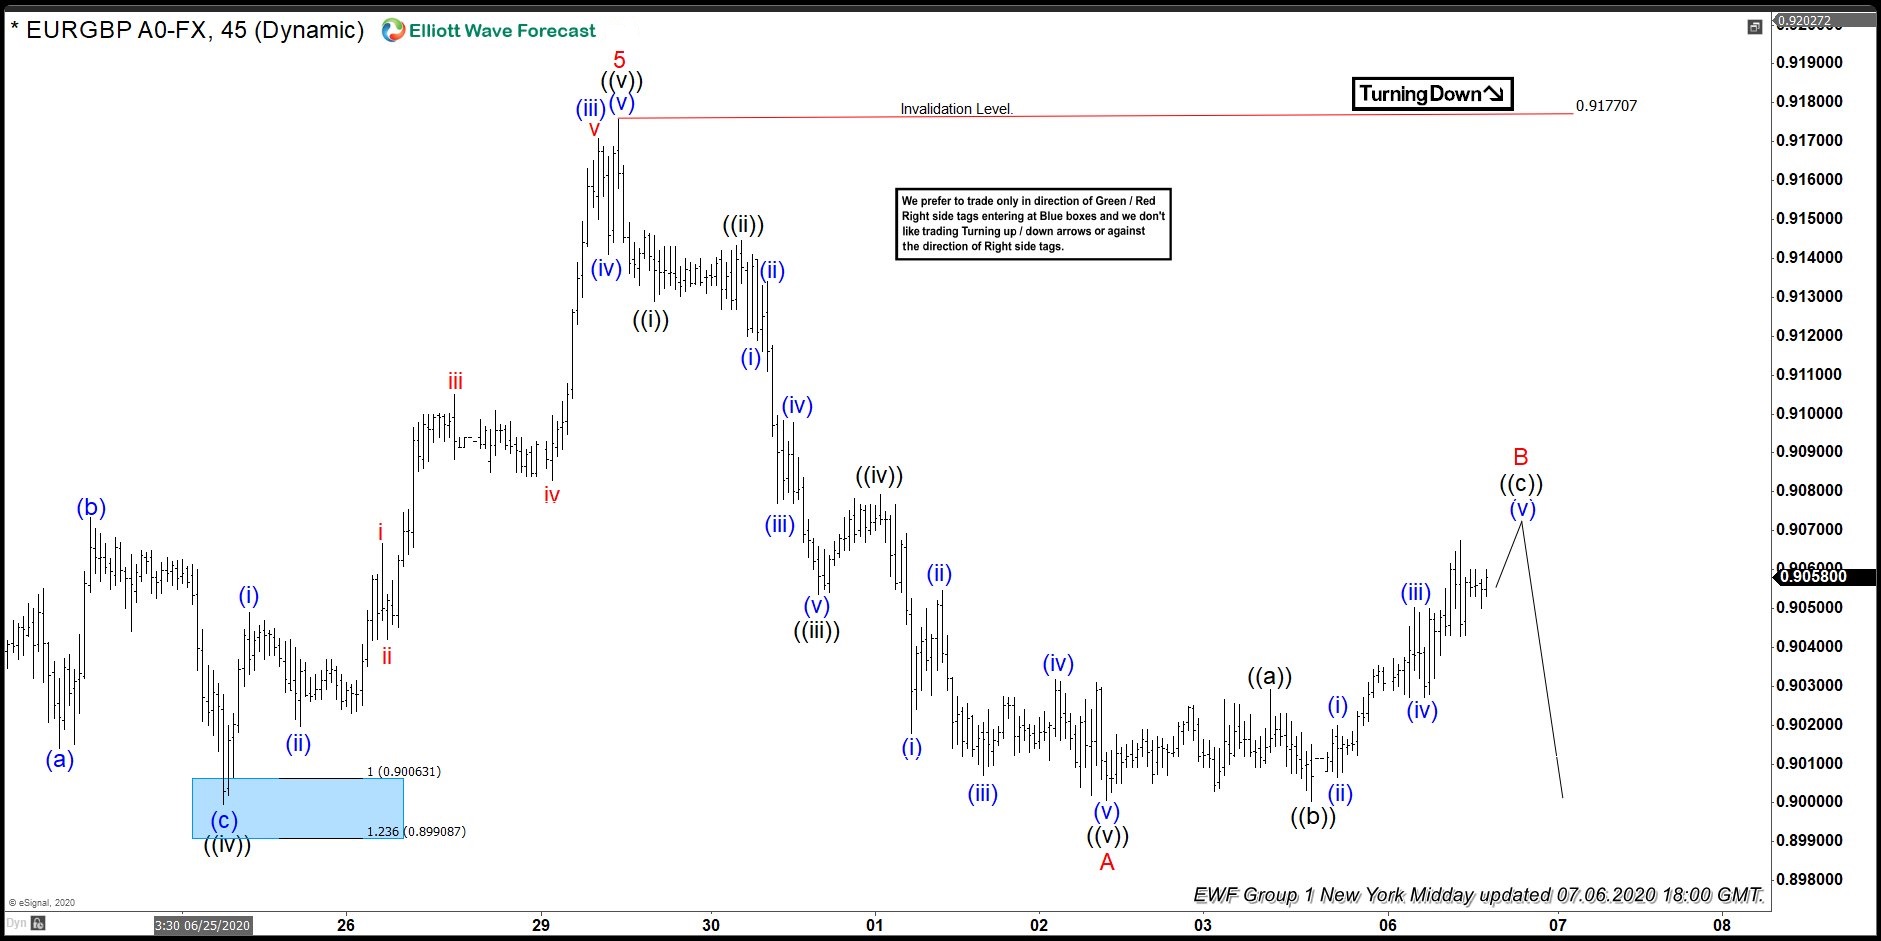
In this blog, we are going to take a look at the Elliott Wave chart of EURGBP. The 1 hour NY Midday chart update from July 6 shows that the pair has ended the cycle from April 30 low at 0.9177 high. The sub-waves of the rally unfolded as 5 waves impulsive structure. Elliott Wave theory dictates that 3 waves pullback should happen afterwards before the rally continues. Pair then decline lower from June 29 high. The decline unfolded as 5 waves and can be counted as wave A, where it ended at 0.9000 low. Since the first leg lower was in 5 waves, the correction is expected to unfold as zig-zag Elliott Wave structure. The pair is expected to bounce in wave B, which was still in progress. Afterwards, the pair can resume for another leg lower in wave C to end the zig-zag correction.
EURGBP 7.6.2020 1 Hour NY Midday Elliott Wave Update
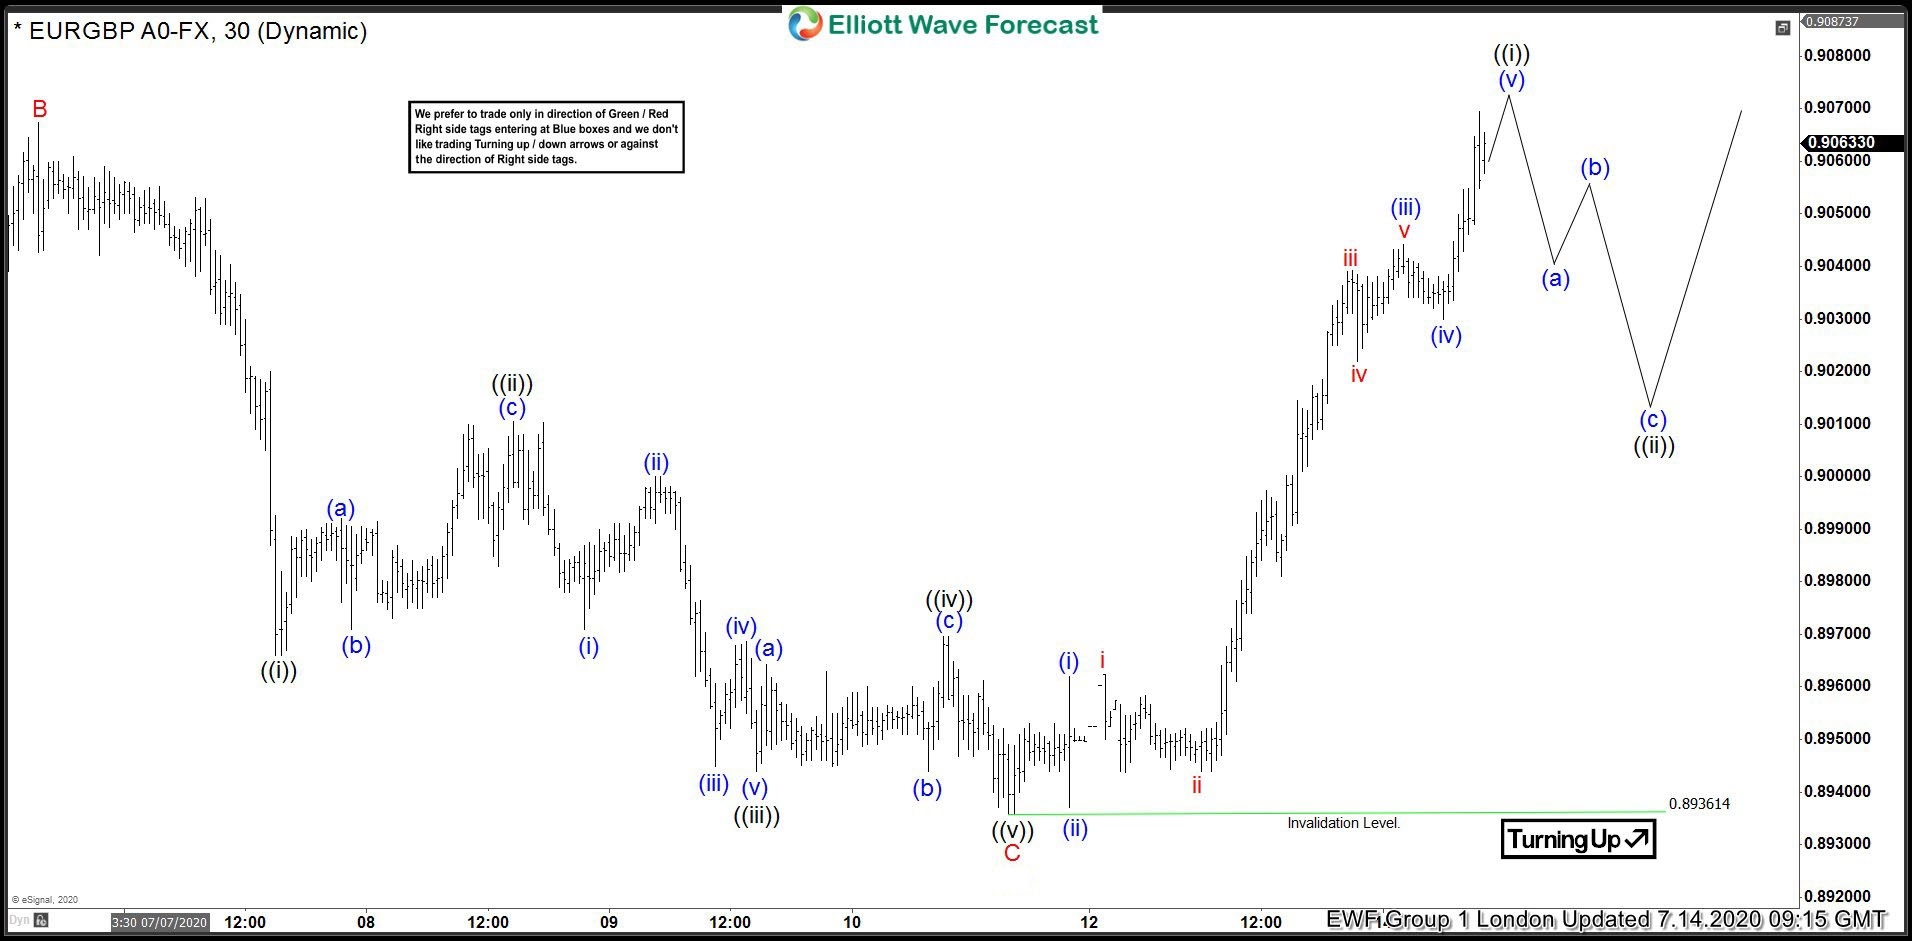
The latest London chart update from July 14 shows that EURGBP ended wave B at 0.9067 high. The pair then extended lower in wave C as expected. The subdivision of wave C unfolded as 5 waves and ended at 0.8936 low. From there, the pair resumed higher. While above 0.8936 low, expect the dip in 3,7, or 11 swings to continue to find support for more upside. However, the pair needs to break above June 29 high at 0.9177 to confirm that correction is complete. Otherwise, pair can still do 7 or 11 swings to correct the cycle from April 30 low.
EURGBP 7.14.2020 1 Hour London Elliott Wave Update