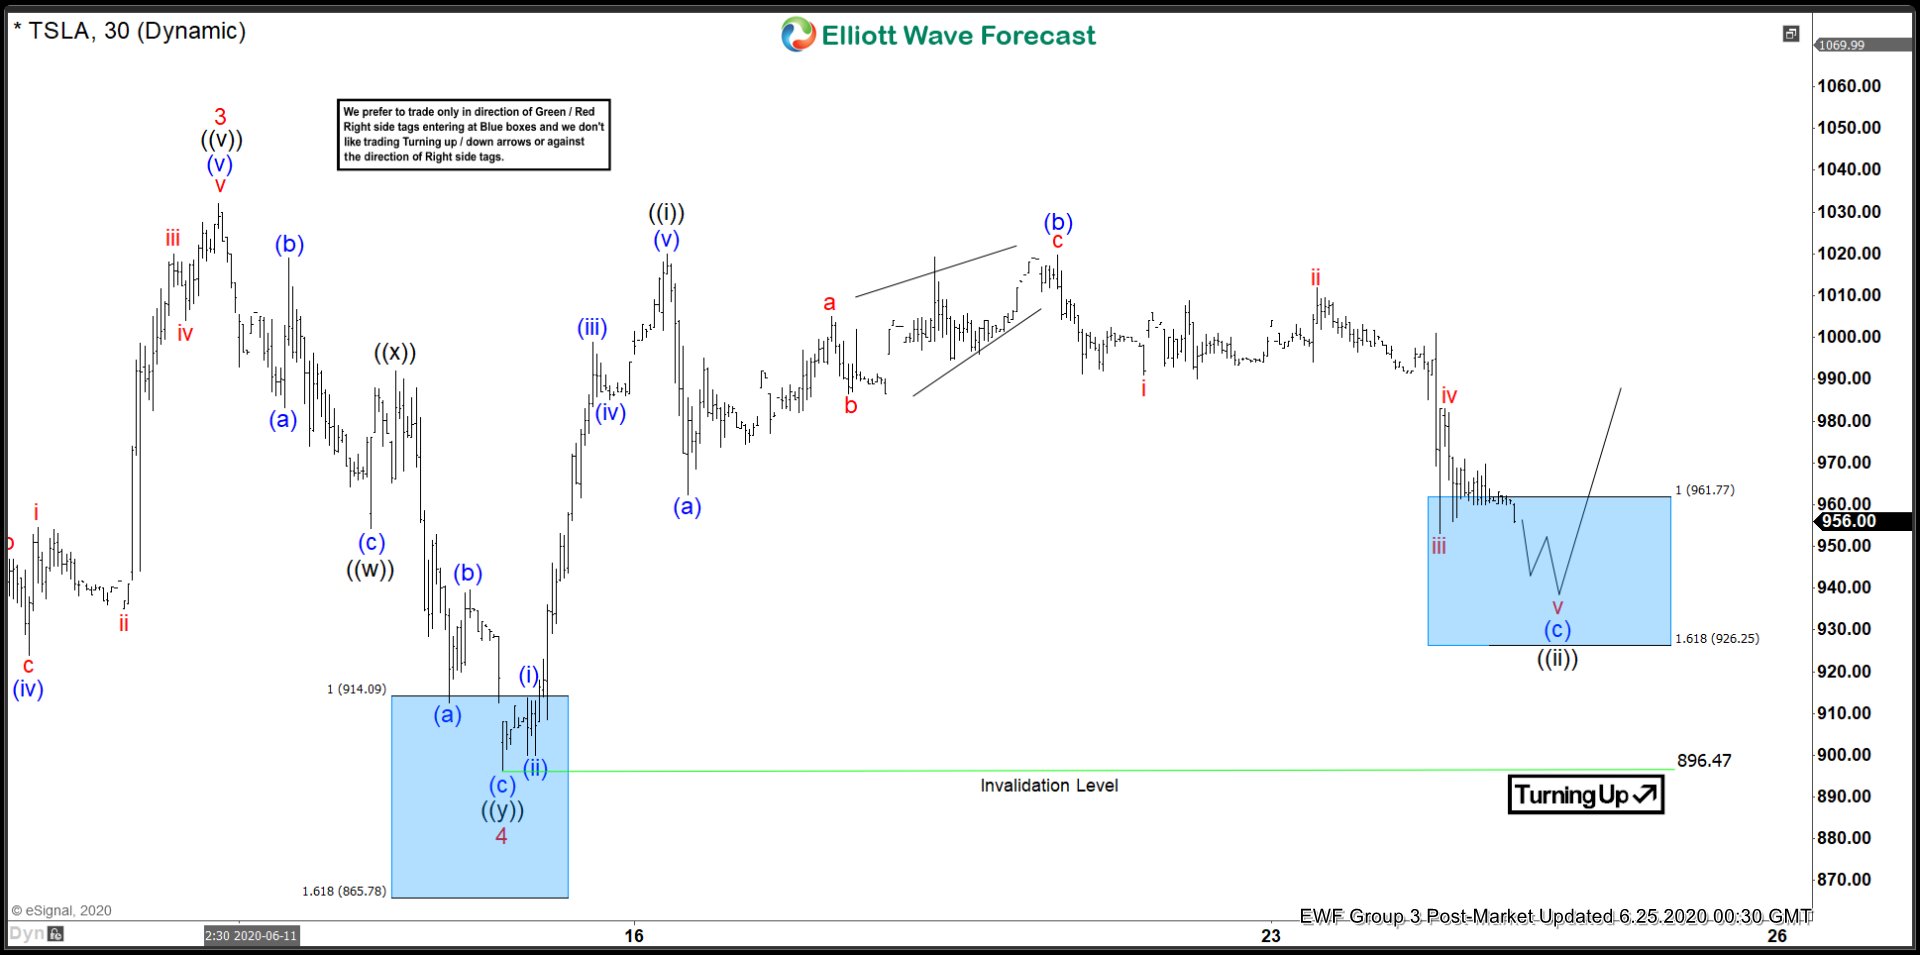
In this blog, we are going to take a look at the Elliott Wave chart of TSLA (Tesla). The 1 hour post market update from June 25, 2020 shows that the stock extended higher from wave 4 low. The rally from June 15 low in wave ((i)) unfolded as 5 waves impulse Elliott Wave Structure and ended at 1019.85 high. The stock then did a pullback to correct that cycle as a zig-zag structure. Down from wave ((i)) high, wave (a) ended at 962.39 low. The bounce in wave (b) ended at 1019.74 high. The pair then continued to push lower in wave (c). The 100%-161.8% extension of wave (a)-(b) where (c) can potentially end is at 926.25-961.77 area. We showed this area with a blue box. This is the area where we expect buyers to appear for 3 waves bounce at least or an extension higher.
TSLA 25 June Post Market Elliott Wave Update
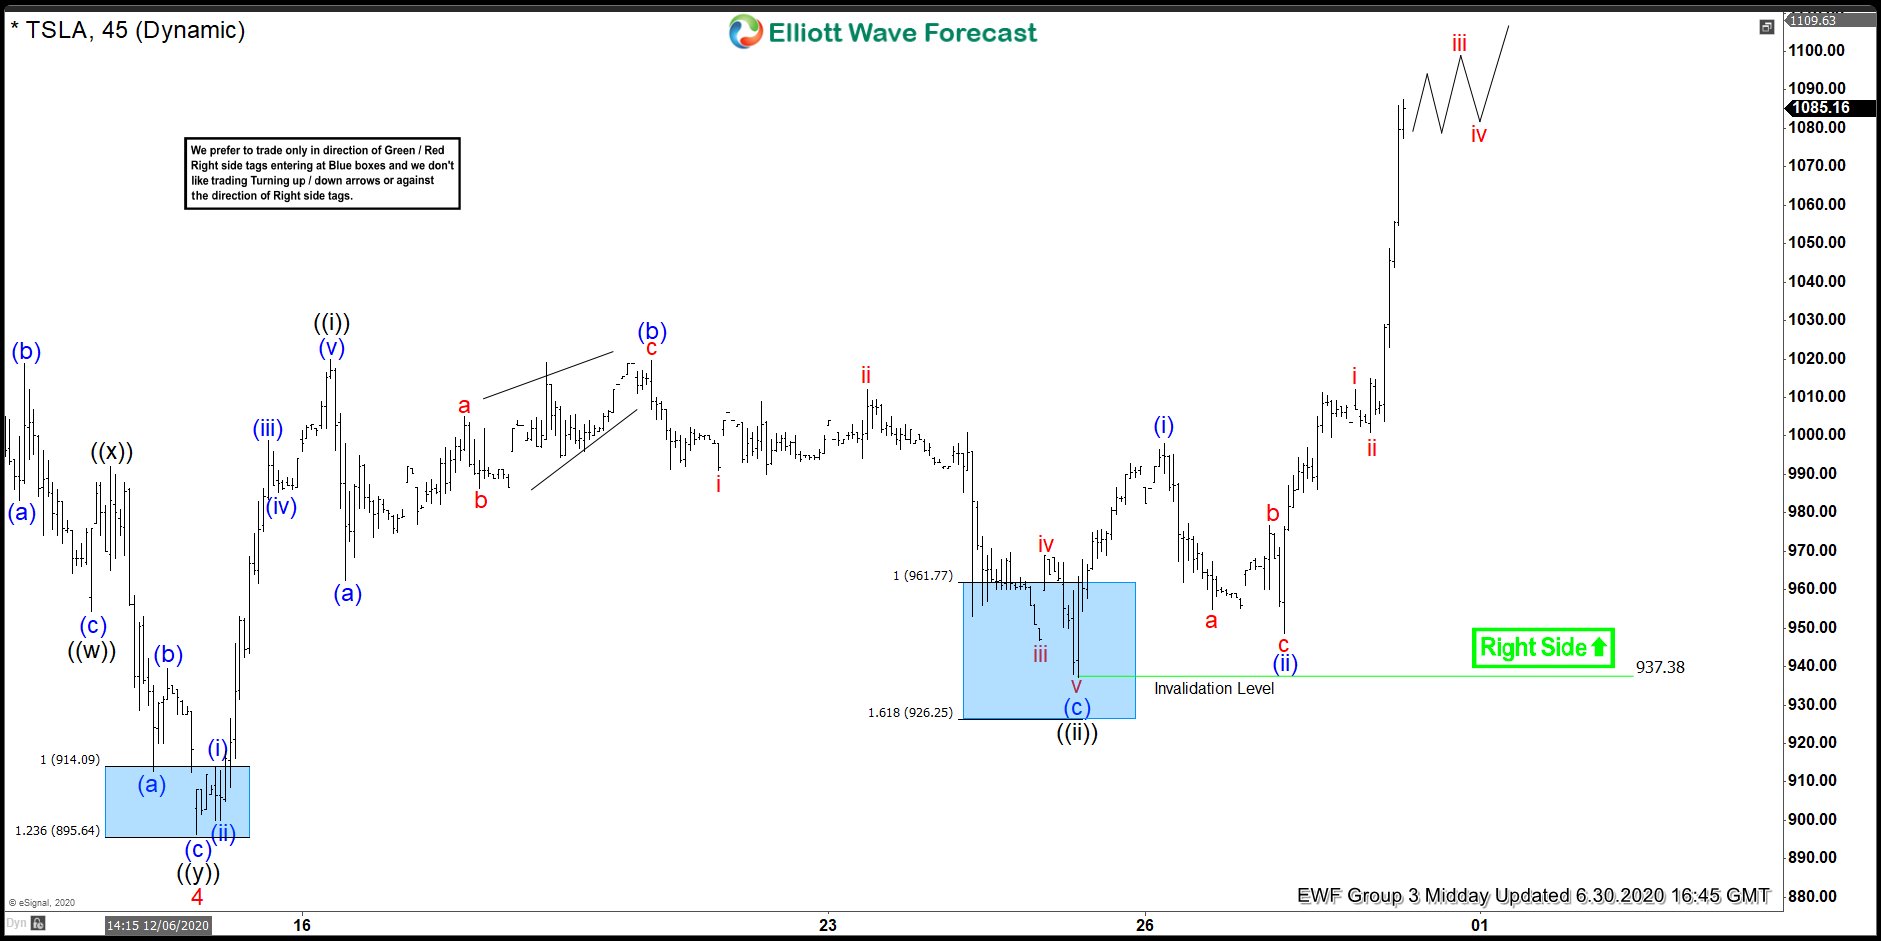
June 30 Midday update shows that TSLA ended wave ((ii)) pullback at 937.38 low, which is within the blue box. From there, the pair saw a reaction higher after buyers appeared at that blue box area. The rally broke above previous wave ((i)) high and also wave 3 high, to confirm that wave ((ii)) is already in place and the next leg higher is already in progress. This allows buyers from the blue box a risk free position (stop loss moved to entry).
TSLA 30 June Midday Market Elliott Wave Update
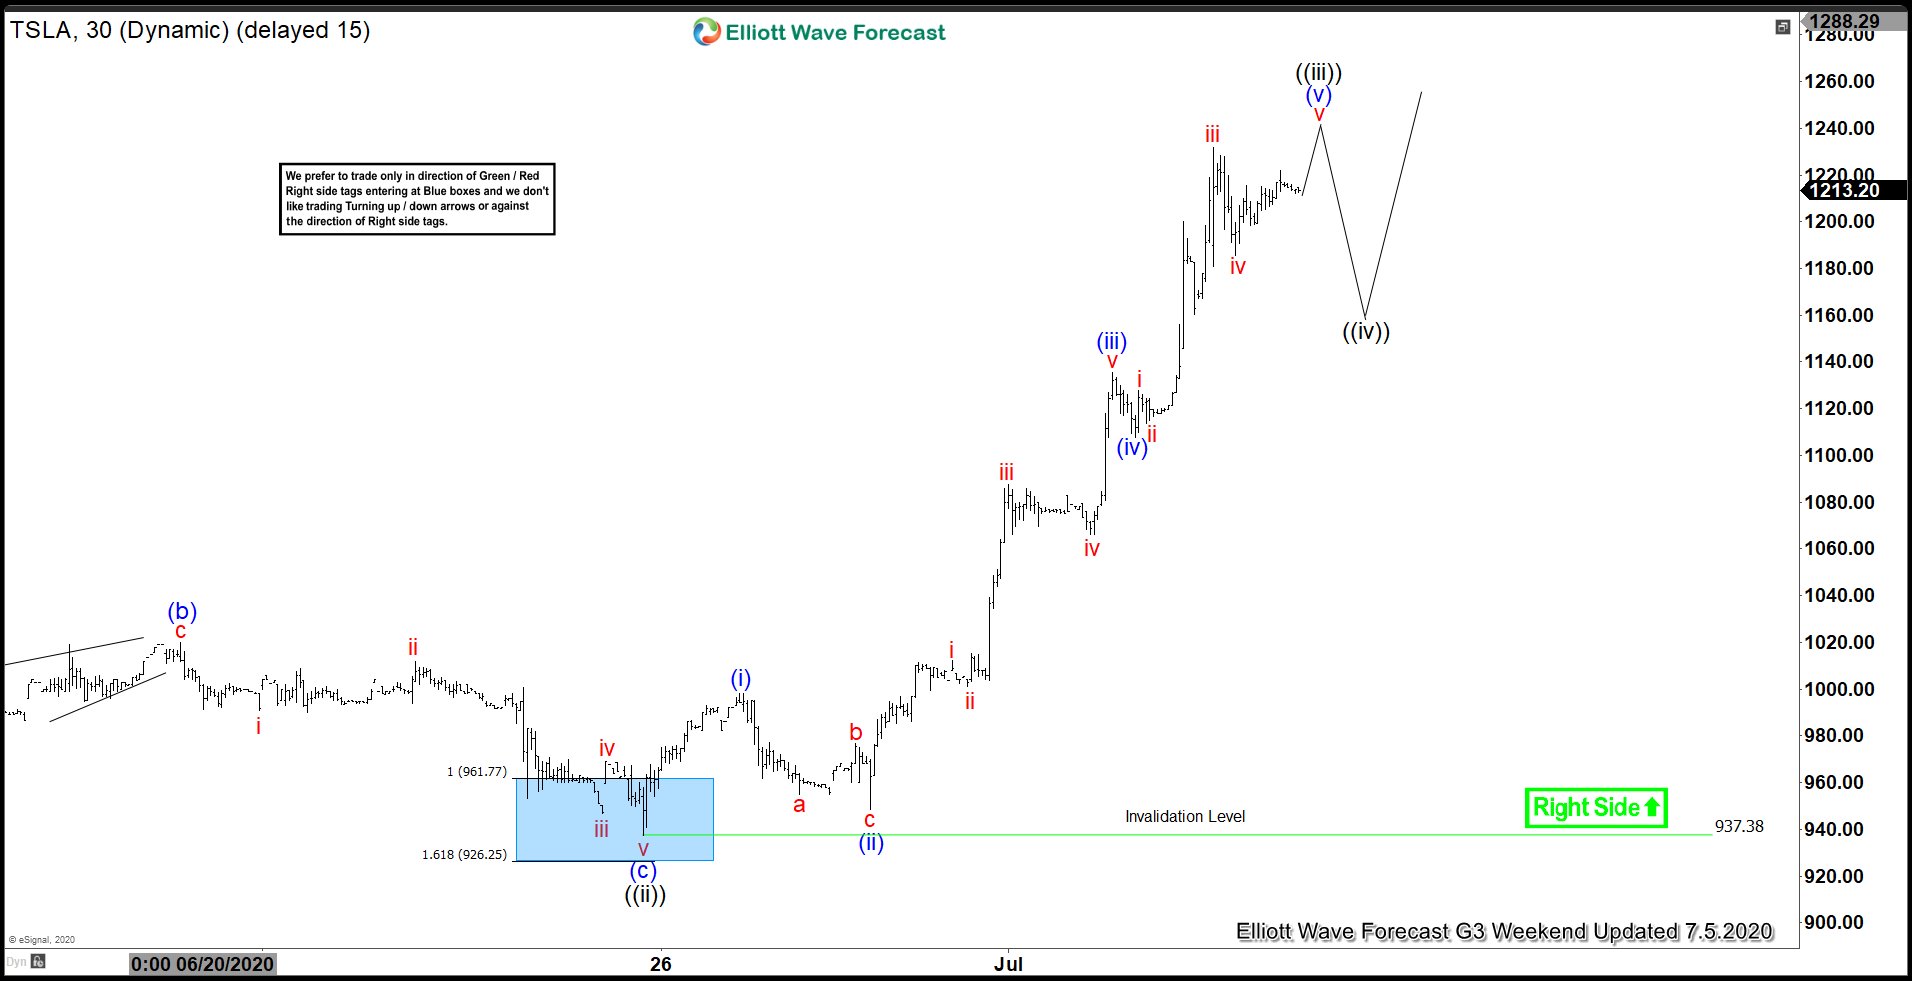
July 5 weekend update shows that TSLA continue to extend higher from the blue box. Up from 937.38 low, wave (i) ended at 998 high and the dip in wave (ii) ended at 948.52 low. The stock then resumed higher and ended wave (iii) at 1135.33 high. Wave (iv) pullback ended at 1066 low. Currently, the stock is close to ending wave (v), which would end wave ((iii)) in larger degree. A pullback in wave ((iv)) should follow after that. As long as the low at 937.38 stays intact, expect dips in 3,7, or 11 swings to find support for more upside.
TSLA 5 July Weekend Elliott Wave Update