Nasdaq (NQ_F) has made an all-time high suggesting that the Covid-19 correction is over at 6628.75. Index has now resumed higher and short term 30 minutes chart below suggests the rally to 9742.5 ended wave 1 and pullback to 9572.34 ended wave 2. Wave 3 is currently in progress and the subdivision is unfolding as a 5 waves Elliott Wave structure.
Up from wave 2 low at 9572.34, wave (i) ended at 9704.25 and wave (ii) dips ended at 9601.75. Wave (iii) ended at 9846.25, wave (iv) ended at 9789.50 and wave (v) ended at 9875.50. This 5 waves move ended wave ((i)) in larger degree. Pullback in wave ((ii)) then ended at 9747.00 as a double three where wave (w) ended at 9796.5, wave (x) ended at 9838.75, and wave (y) of ((ii)) ended at 9747.
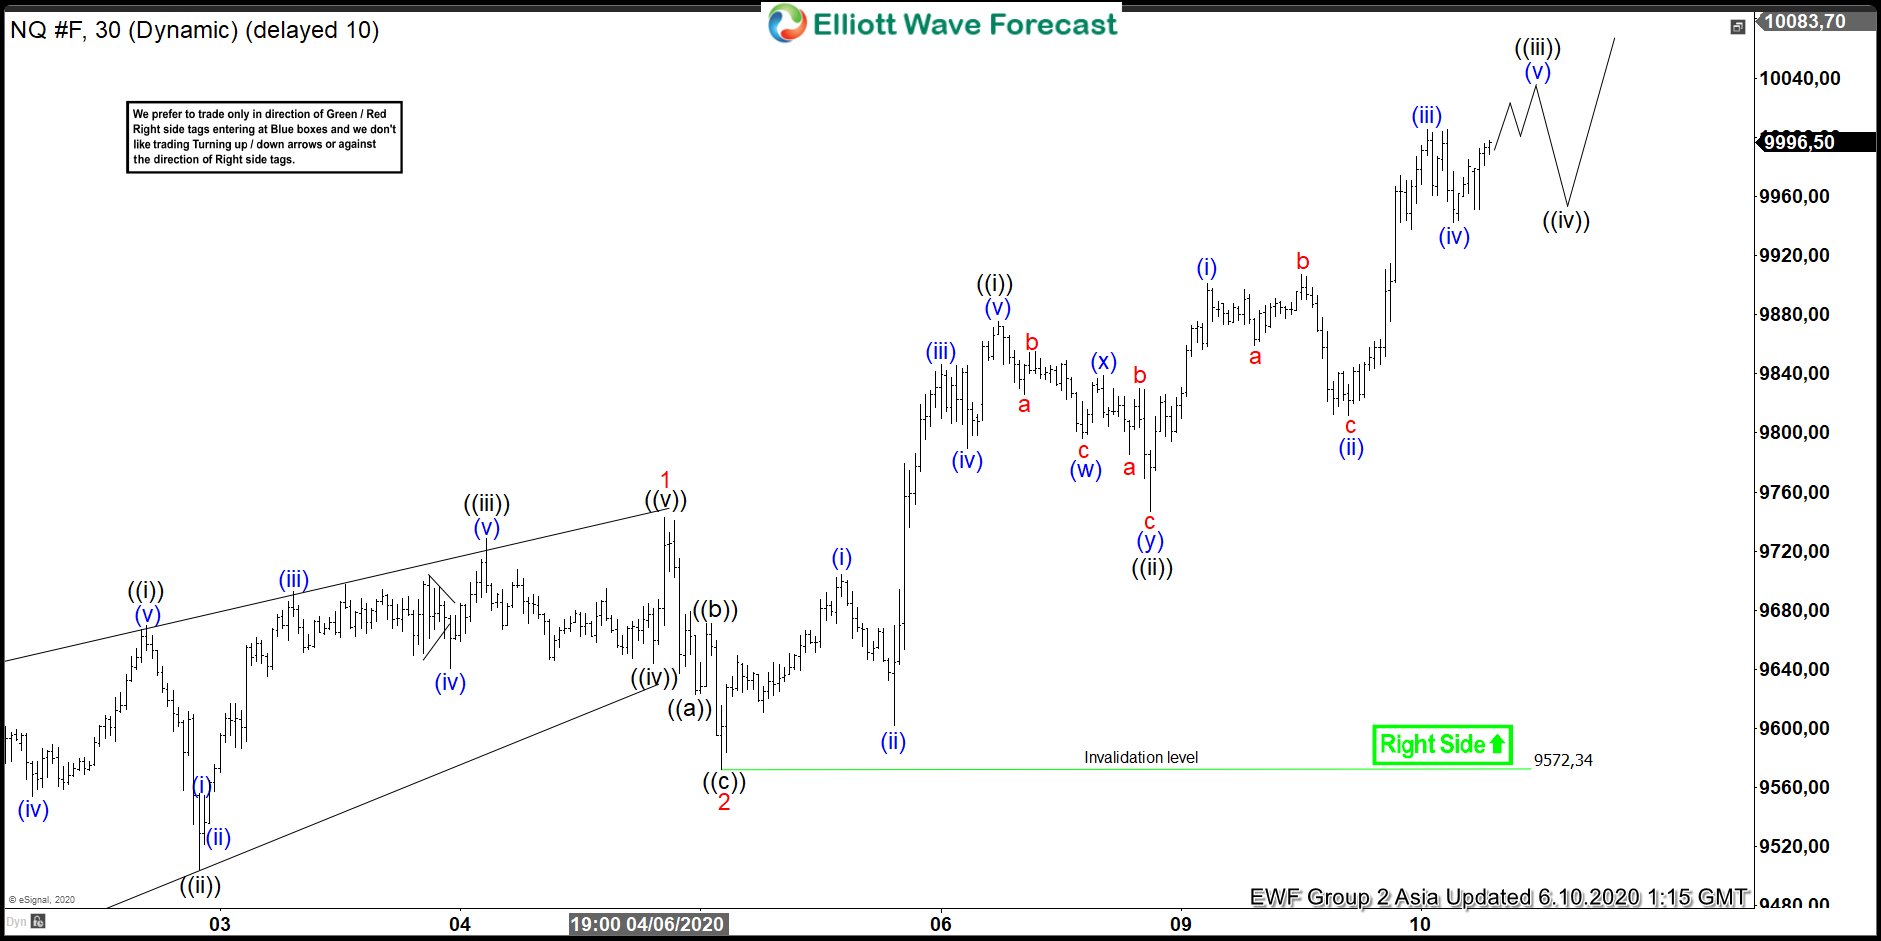
Index then resumes higher in wave ((iii)). Up from wave ((ii)) at 9747, wave (i) ended at 9901 and wave (ii) pullback ended at 9811.50. Wave (iii) ended at 10005.25 and wave (iv) pullback ended at 9942.25. Expect the Index to end wave (v) of ((iii)) soon, then pullback in wave ((iv)) before resuming the rally again. As far as pivot at 9572.34 low stays intact, expect dips to continue finding support in 3, 7, or 11 swing.
Nasdaq 30 Minutes Elliott Wave Chart