
In this technical blog, we are going to take a look at the past performance of 1 hour Elliott Wave Charts of the Nifty index from India. In which, the rally from 24 March 2020 low unfolded as an impulse 5 wave structure. Thus suggested that it’s a continuation pattern. And as per Elliott wave theory after a 3 waves pullback, it should do another extension higher in 5 waves impulse structure at least. Therefore, we advised members not to sell the instrument & trade the no enemy areas ( blue boxes) as per Elliott wave hedging remained the preferred path looking for 3 wave reaction higher at least. We will explain the structure & forecast below:
Nifty 1 Hour Elliott Wave Chart
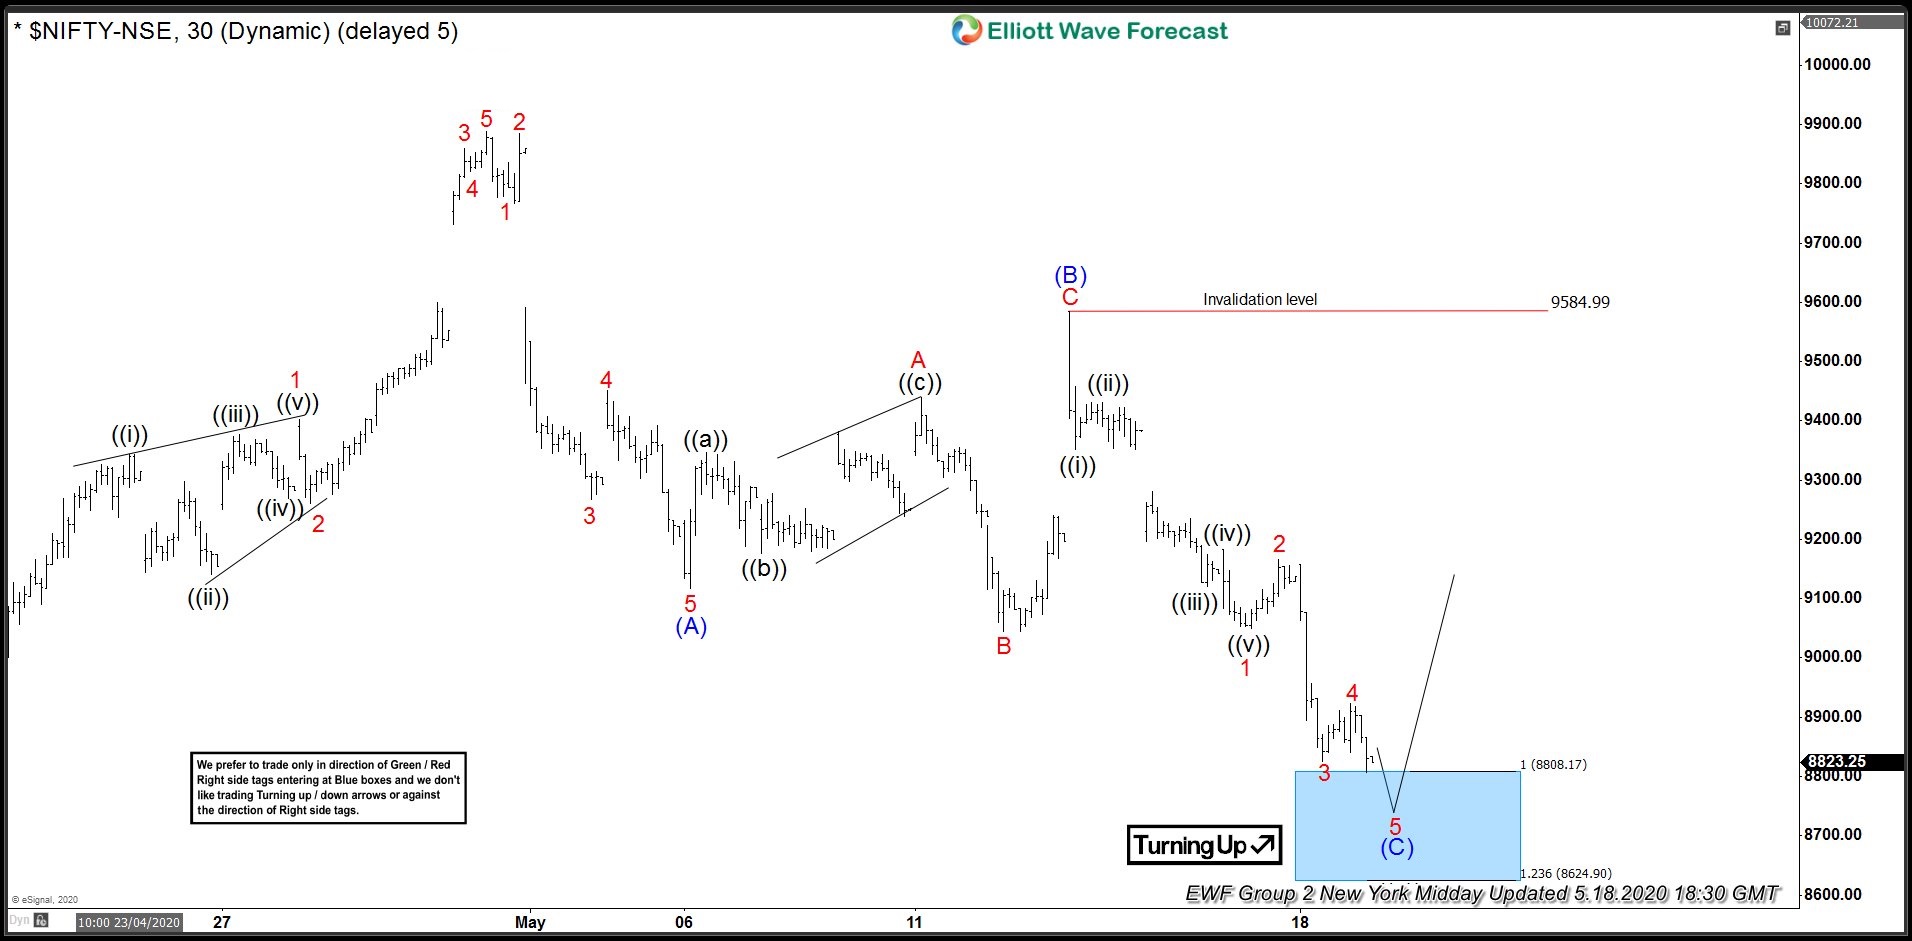
Nifty 1 Hour Elliott Wave from 5/18/2020 NY Midday update. In which, the rally to 9889 high ended wave ((1)). Down from there, the index corrected lower the cycle from 3/24/2020 low. The internals of that pullback unfolded as a zigzag structure where wave (A) ended in lesser degree 5 waves at 9116 low. Up from there, wave (B) bounce ended as a lesser degree flat correction at 9584 high. Down from there, wave (C) managed to reach the blue box area at 8808-8624 100%-123.6% Fibonacci extension area of (A)-(B). From where the buyers were expected to appear in the index looking for another 5 waves rally or to do a 3 wave reaction higher at least.
Nifty 1 Hour Elliott Wave Chart
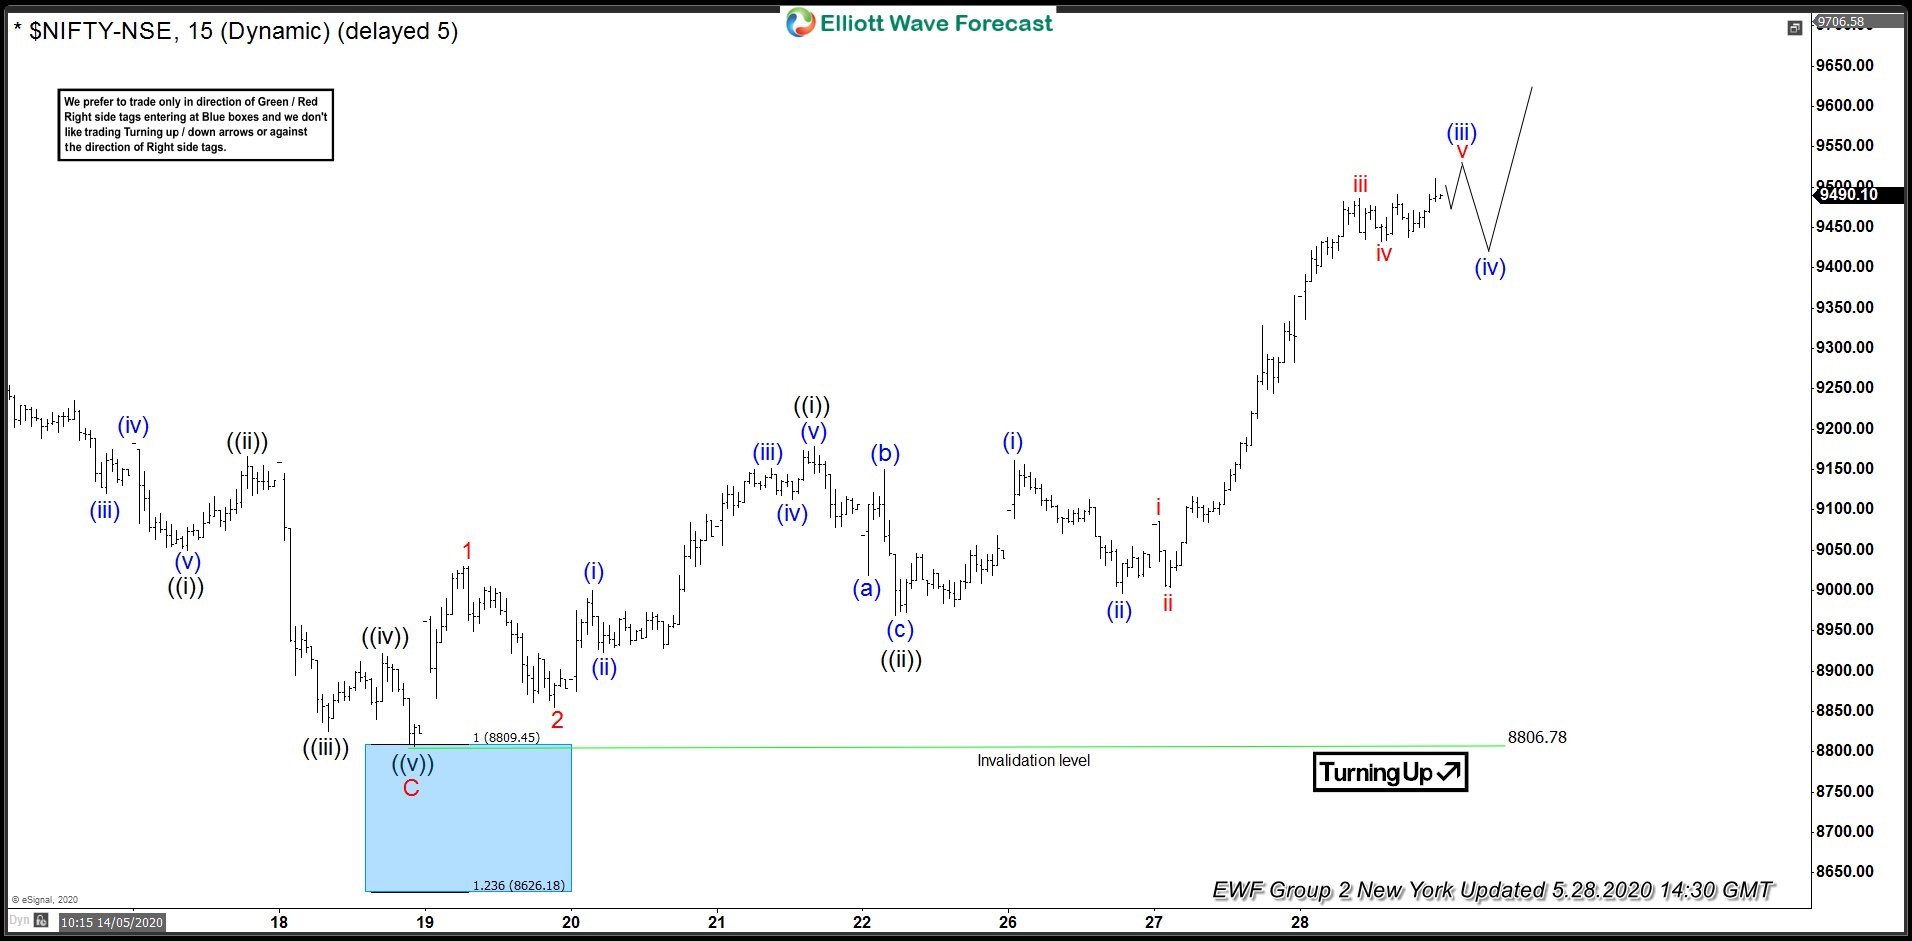
Here’s 1 Hour Elliott Wave Chart of Nifty From 5/28/2020 New York Update. In which, the index is showing reaction higher taking place from the blue box area. Allowed members to create a risk-free position shortly after taking the longs at 8808-8624 blue box area.