
Hello fellow traders. In this technical blog we’re going to take a quick look at the Elliott Wave charts of EURCAD. As our members know, recently the pair gave us 3 waves bounce against the 1.53878 peak. Recovery unfolded as Elliott Wave Zig Zag pattern (a)(b)(c). Once the price reached equal legs (a)-(b) we knew that sellers will appear there for a 3 wave pull back at least. In the further text we are going to explain the Elliott Wave Pattern and the Forecast.
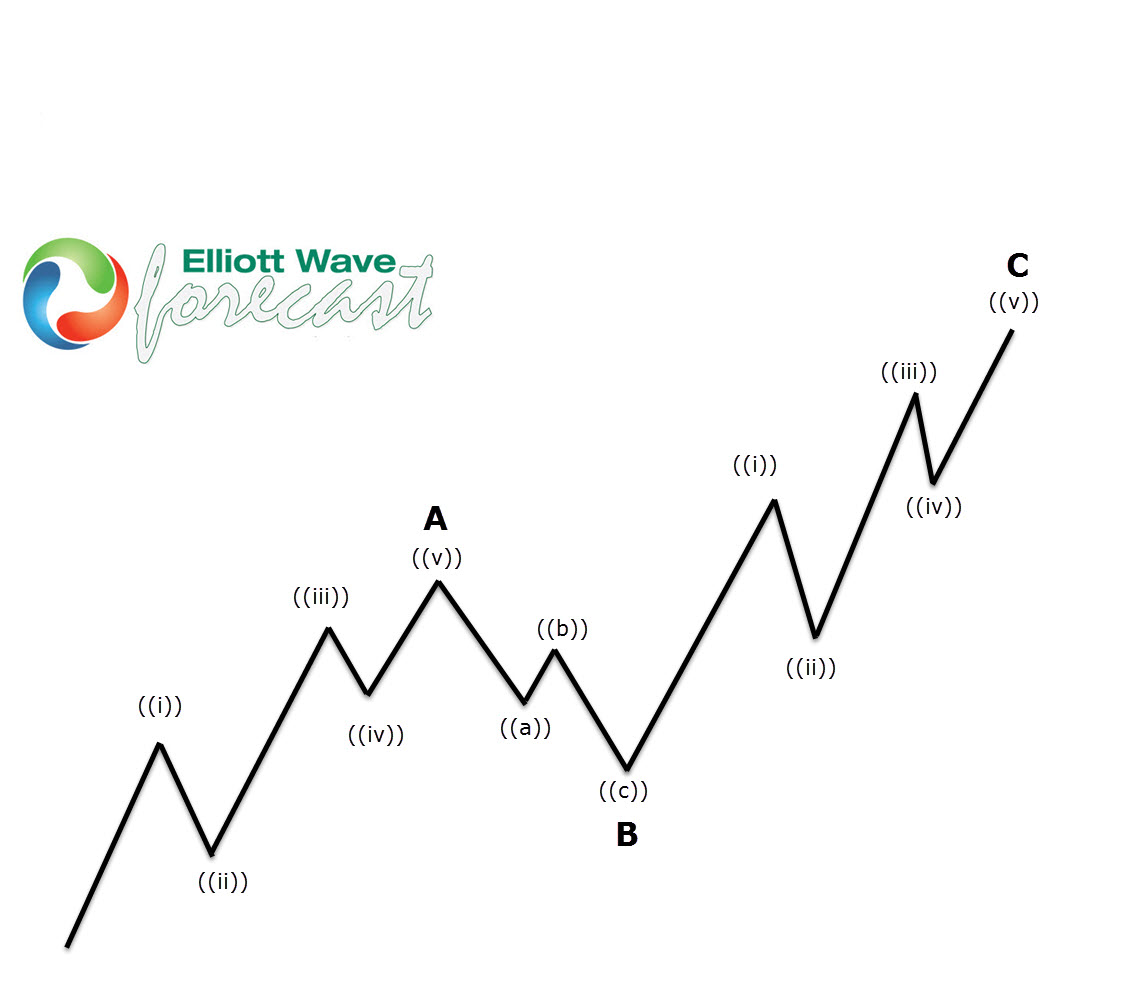
Before we take a look at the real market example, let’s explain Elliott Wave Zigzag pattern.
Elliott Wave Zigzag is the most popular corrective pattern in Elliott Wave theory . It’s made of 3 swings which have 5-3-5 inner structure. Inner swings are labeled as A,B,C where A =5 waves, B=3 waves and C=5 waves. That means A and C can be either impulsive waves or diagonals. (Leading Diagonal in case of wave A or Ending in case of wave C) . Waves A and C must meet all conditions of being 5 wave structure, such as: having RSI divergency between wave subdivisions, ideal Fibonacci extensions and ideal retracements.
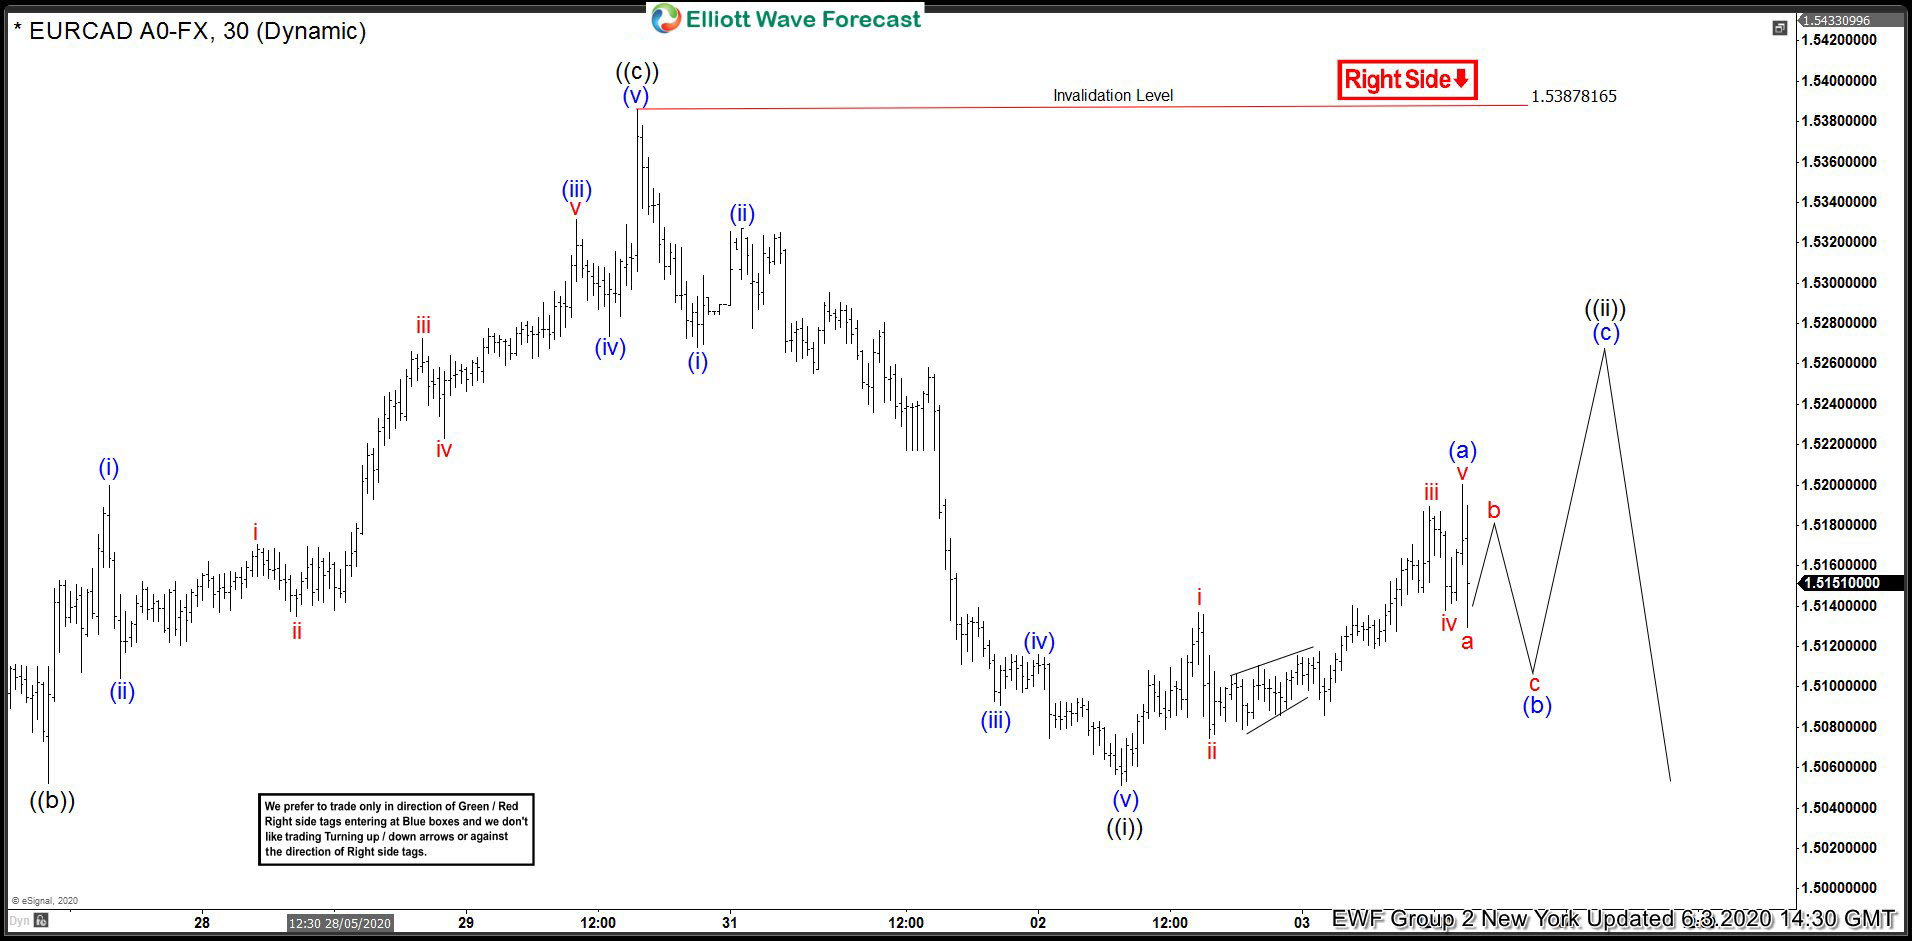
EURCAD Elliott Wave Analysis 06.03.2020
EURCAD is correcting the cycle from the 1.5387 peak. Recovery looks incomplete at the moment, as we got 5 waves up from the lows. Suggesting we have ended only first leg of potential Elliott Wave Zig Zag Pattern . Consequently we are calling for 3 waves pull back in (b) blue and another leg up (c) which should be made out of 5 waves.We don’t recommend buying the pair and favor the short side from higher levels once ((ii)) recovery reaches its extremes. ( blue box)
You can learn more about Zig Zag Elliott Wave Patterns at our Free Elliott Wave Educational Web Page.
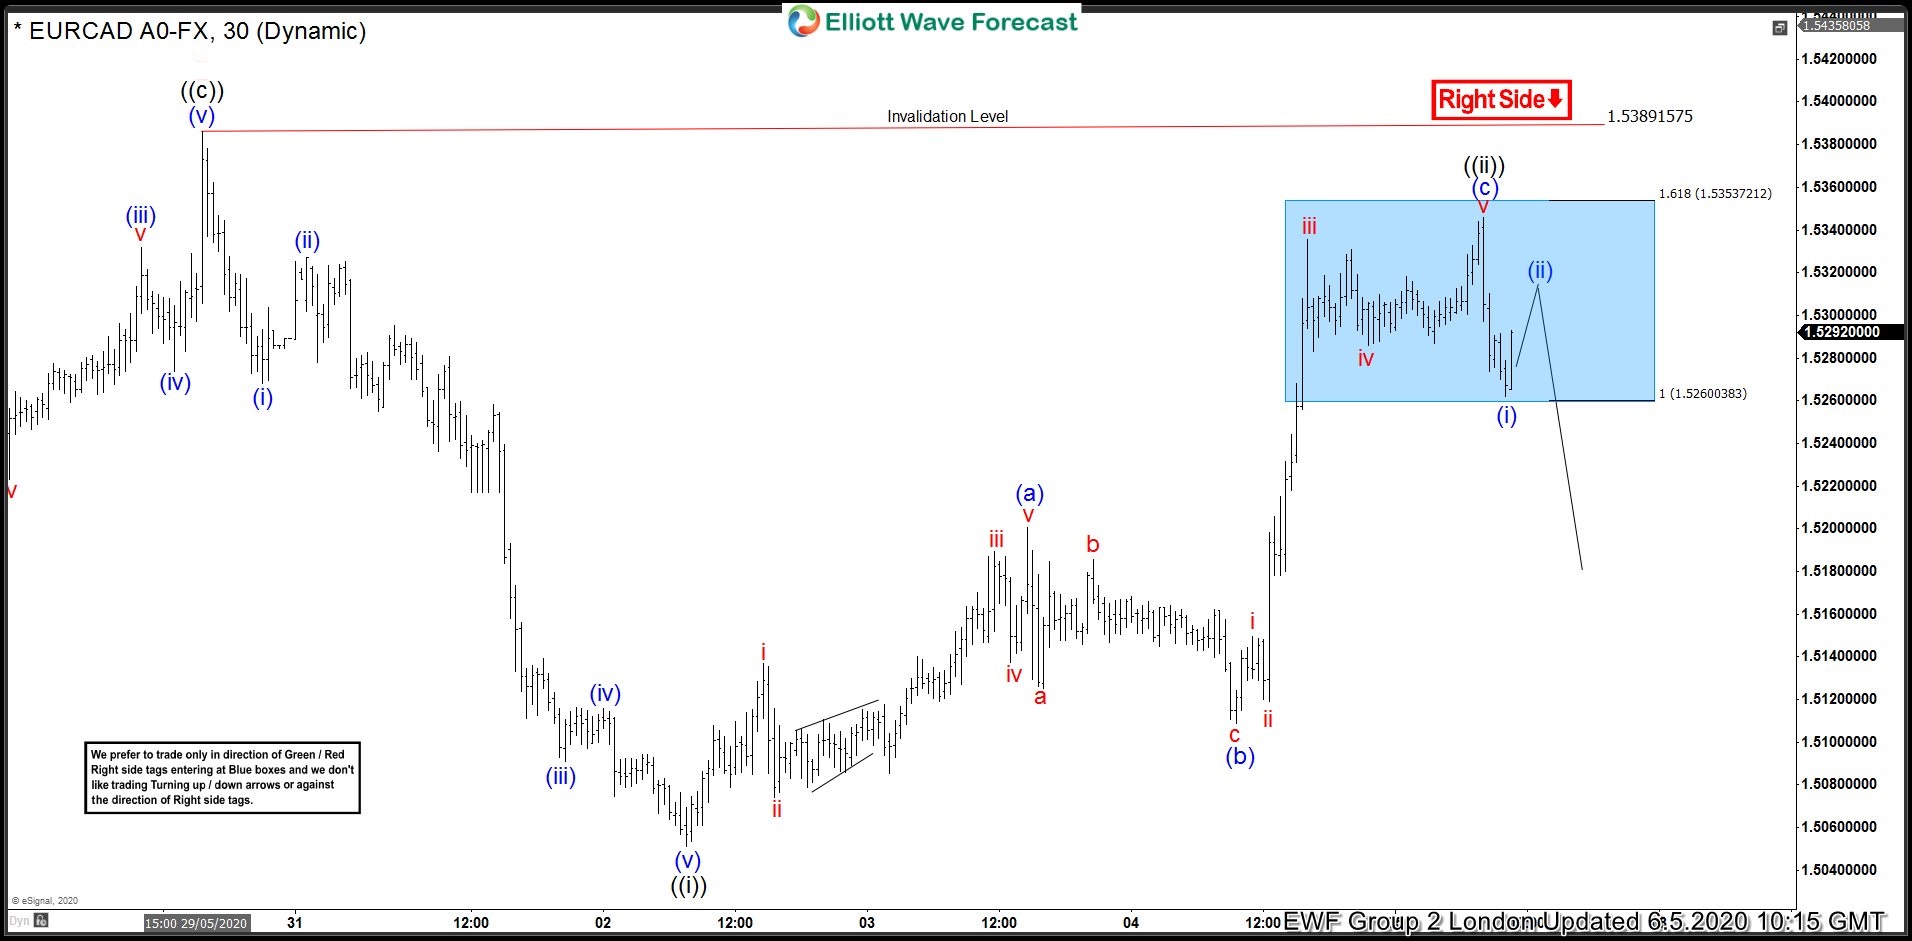
EURCAD Elliott Wave Analysis 06.05.2020
At the chart below we can see what Elliott Wave Zig Zag Pattern looks like in real market example. We got 3 waves pull back (b) blue and then 5 waves up in (c) blue as we expected. That was classic example of Elliott Wave Zig Zag Pattern. The price reached equal legs area at 1.5260-1.5353 ( blue box) . We expect sellers to appear there for proposed decline or 3 wave pull back at least. As our members know Blue Boxes are no enemy areas , giving us 85% chance to get a pull back. At this stage we are calling recovery completed at 1.5344 high.
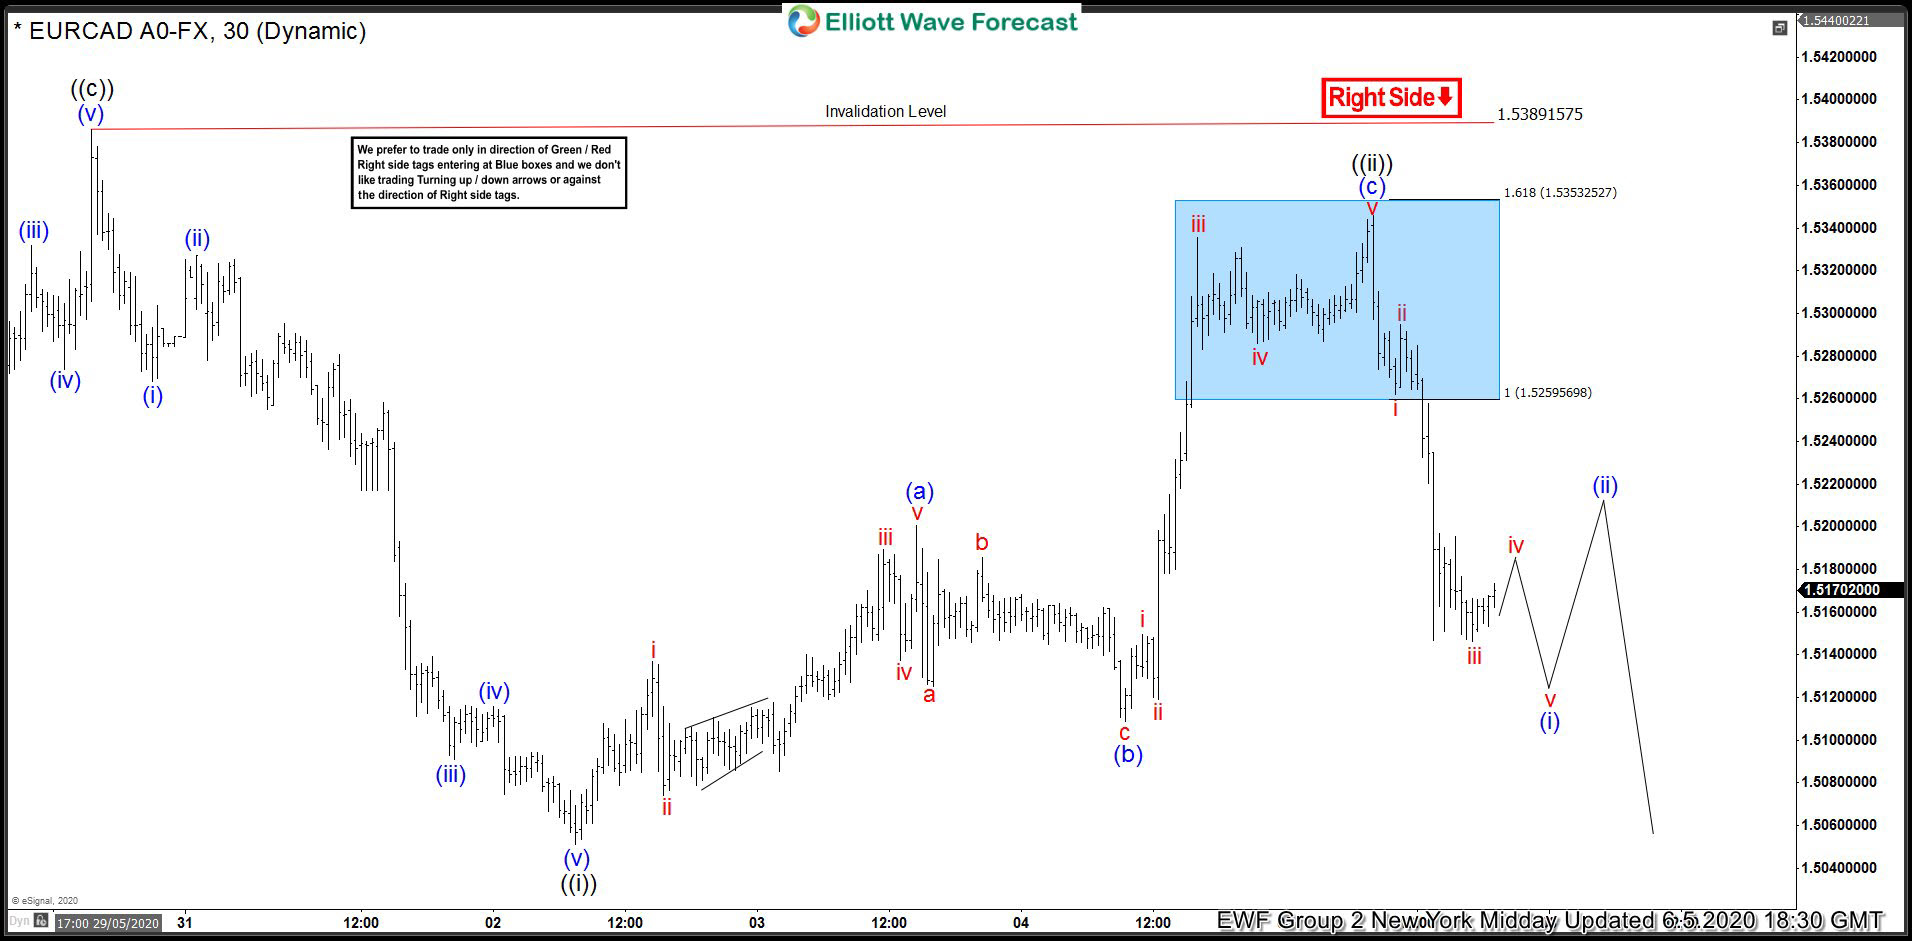
EURCAD Elliott Wave Analysis 06.05.2020
The pair made further decline and separated from the last peak. Members who took short trades are now enjoying profits within risk free positions. Now we would like to see further extension down and break below ((ii)) – 06/02 low which would be confirmation wave ((iii)) is in progress.
Keep in mind market is dynamic and presented view could have changed in the mean time. You can check most recent charts in the membership area of the site. Best instruments to trade are those having incomplete bullish or bearish swings sequences.We put them in Sequence Report and best among them are shown in the Live Trading Room.
Elliott Wave Forecast