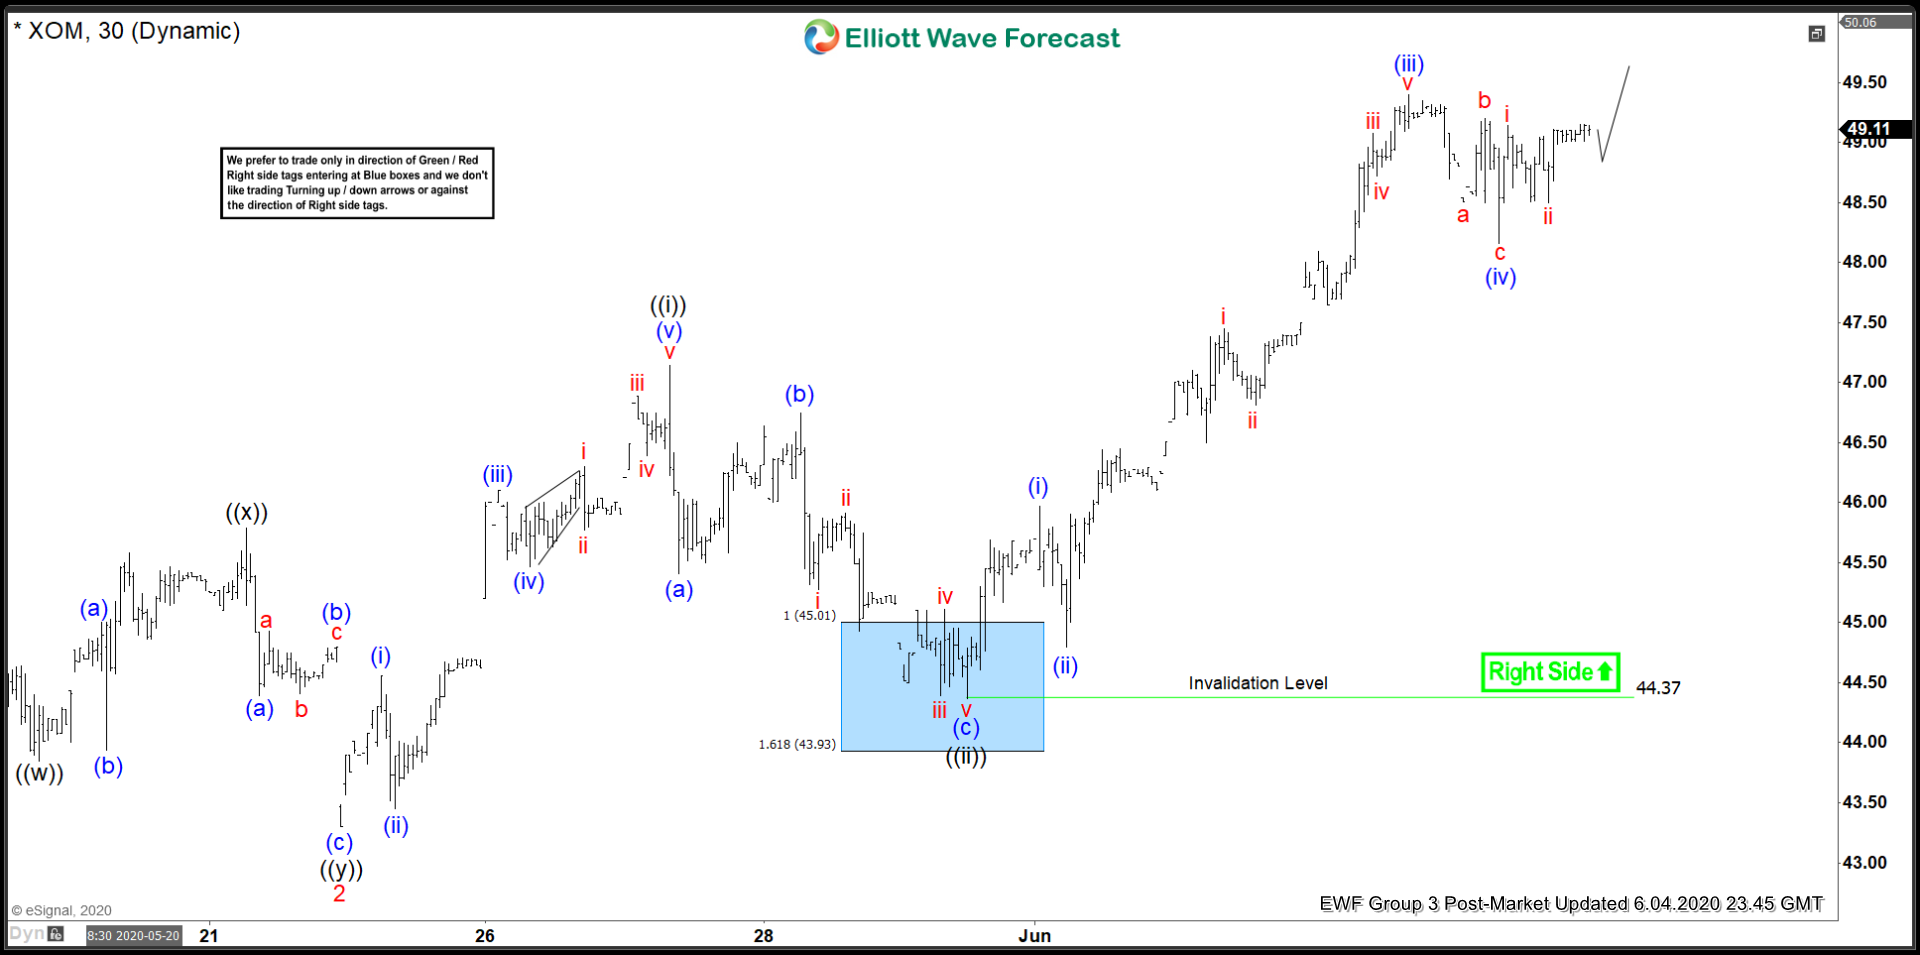
Exxon Mobil (ticker: XOM) shows an incomplete bullish sequence from 3.23.2020 low favoring more upside. Short term, the rally from 5.15.2020 low is unfolding as a 5 waves Impulse Elliott Wave structure. Up from 5.15.2020 low, wave 1 ended at 46.63 and wave 2 dips ended at 43.3. Wave 3 is now in progress as another impulse in lesser degree. Up from wave 2 low at 43.3, wave ((i)) ended at 47.14 and pullback in wave ((ii)) ended at 44.37.
Up from there, the stock rallies and ended wave (i) at 45.97 and dips to 44.80 ended wave (ii). Wave (iii) ended at 49.40 and pullback in wave (iv) ended at 48.16. While above there, and more importantly above 44.37, expect the stock to resume higher in wave wave (v). This move also ends wave ((iii)) in higher degree, then it should pullback in wave ((iv)) and then resumes higher again. The stock should see a few more highs to complete 5 waves up from 5.15.2020 low.
Short term, XOM still needs to break above 49.40 to avoid a double correction. Short Term target higher is 61.8 – 76.4 Fibonacci extension from 3.23.2020 low which comes at 51.9 – 54.7 area. Stock eventually has scope to reach 100% – 123.6% Fibonacci extension from 3.23.2020 low which comes at 59.17 – 63.65.
Exxon Mobil 30 Minutes Elliott Wave Chart