
In this blog, we are going to take a look at the Elliott Wave chart of EURCAD. The 4 hour chart update from May 29 shows that the pair has continued to extend lower from March 19 peak. From March 19 peak, the pair extended lower in wave (W) as a zig-zag. Wave A ended at 1.5207 low and wave B bounce ended at 1.5792 high. The pair then extended lower in wave C, which ended at 1.5118 low. Afterwards, the bounce in wave (X) unfolded as a flat with 3-3-5 structure. Wave (X) bounce ended at 1.5536 high. From that high, the pair continued the decline and ended wave A at 1.5064 low. Currently the bounce in wave B is still in progress and is unfolding as a flat structure.
EURCAD 5.29.20 4 Hour Elliott Wave Update
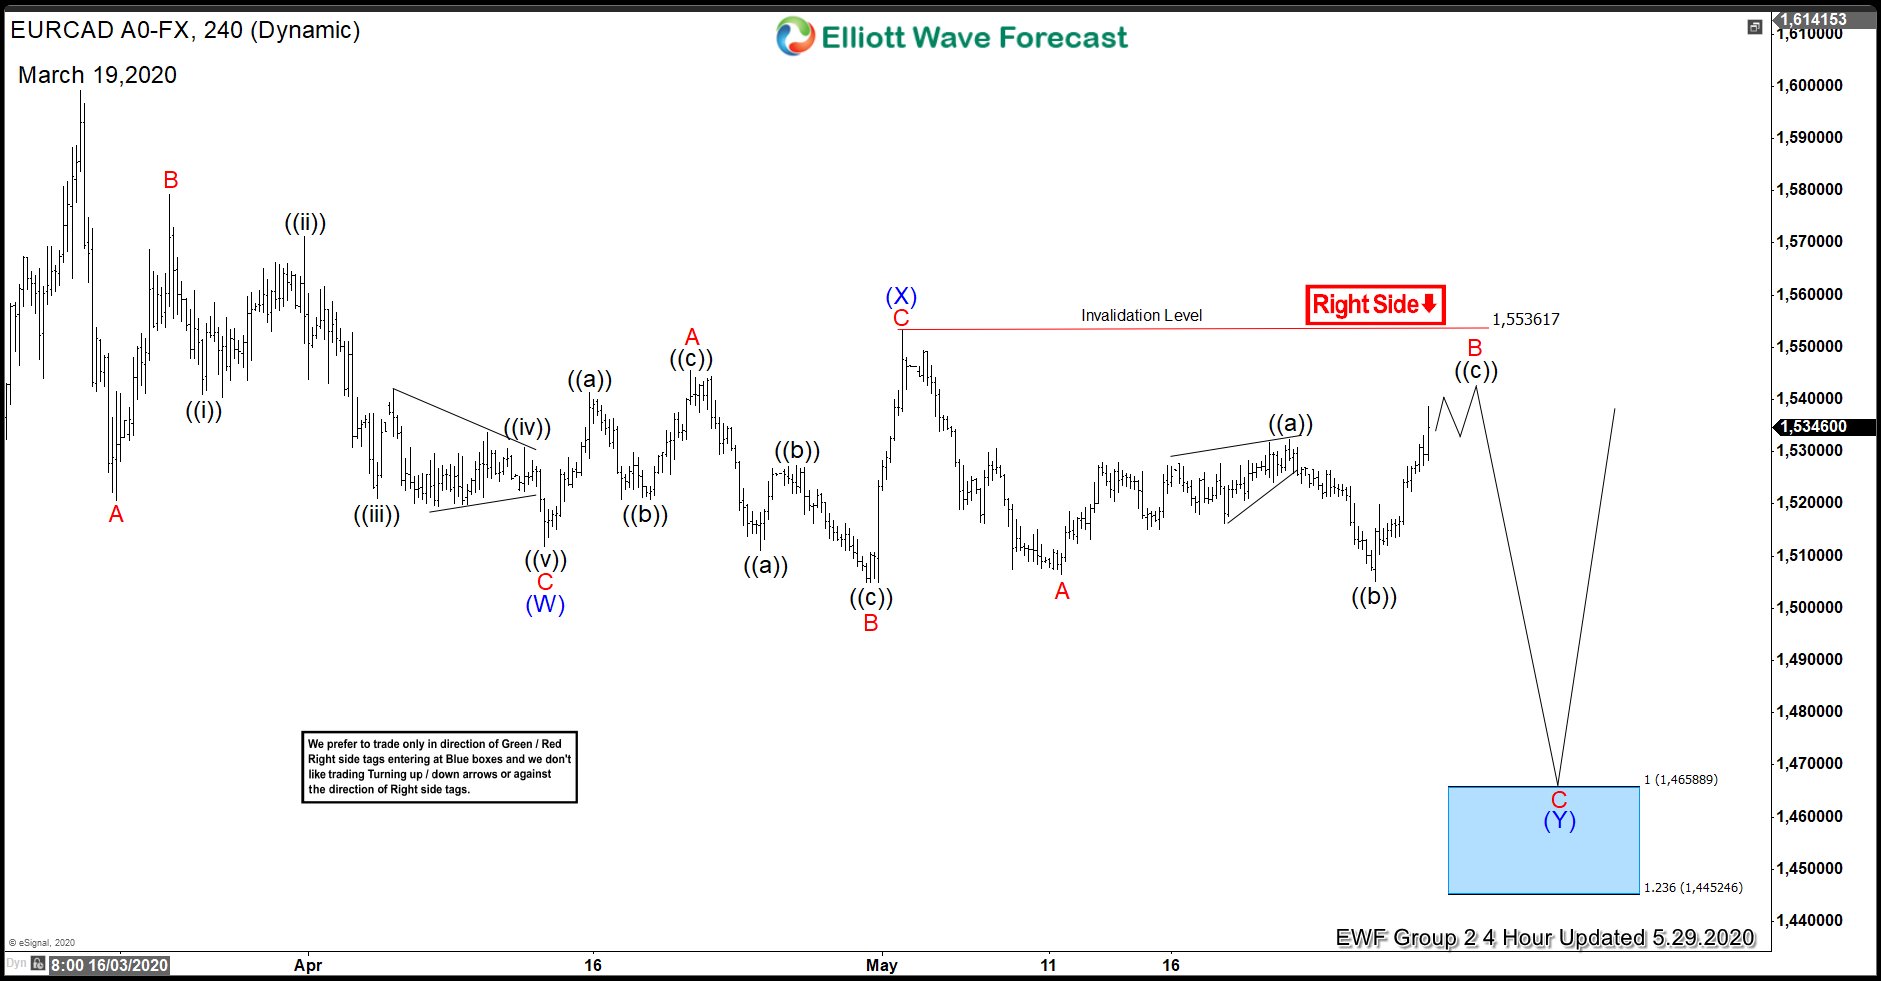
The decline from wave (X) high has broken below the previous low, confirming that the next leg lower is already in progress. Furthermore, the pair now has an incomplete bearish sequence from March 19 against 1.5536 high. The 100% – 123.6 % extension of wave (W)-(X) where wave (Y) can potentially end is between 1.4452 – 1.4658 area. That area is highlighted with a blue box in the chart. As long as 1.5536 high stays intact, the bounce in 3,7 or 11 swings is expected to fail for more downside. The pair has the scope to continue to extend lower until it reaches the blue box to end 7 swings down from March 19 high.